wooldid
Table of contents
Notes
- Based on: Wooldridge’s DiD framework and event-study implementation.
-
Program version (if available): -
- Last checked: 7 Jul 2026
Installation and options
ssc install wooldid, replace
Take a look at the help file:
help wooldid
Test the command
Please make sure that you generate the shared setup data using the setup block given here
Let’s try the basic wooldid command:
wooldid Y id t first_treat, cluster(id) makeplots espre(10) espost(10)
which will show this output:
Wooldid Estimation for Outcome: Y; Standard Errors: cluster(id)

N clusters = 30; N = 1800 (0 obs dropped from initial sample)
R2 = 0.9999;  R2adj = 0.9999; R2-within = 0.9997;  R2-withinadj = 0.9996


Main Results (Full Estimation Sample):

             |  estimate         se          t          p    lb_95ci    ub_95ci      relyr
-------------+----------------------------------------------------------------------------
main         |
         att |  131.3292    .088533   1483.394   2.54e-72   131.1482   131.5103          .
Command results
Additional outputs show:
| Metric | Value |
|---|---|
Sample size (N) |
1,800 |
| Clusters | 30 |
| Main ATT | 131.3292 |
| 95% CI | [131.1482, 131.5103] |
Event-study pretrend ATT (makeplots) |
-0.0078 |
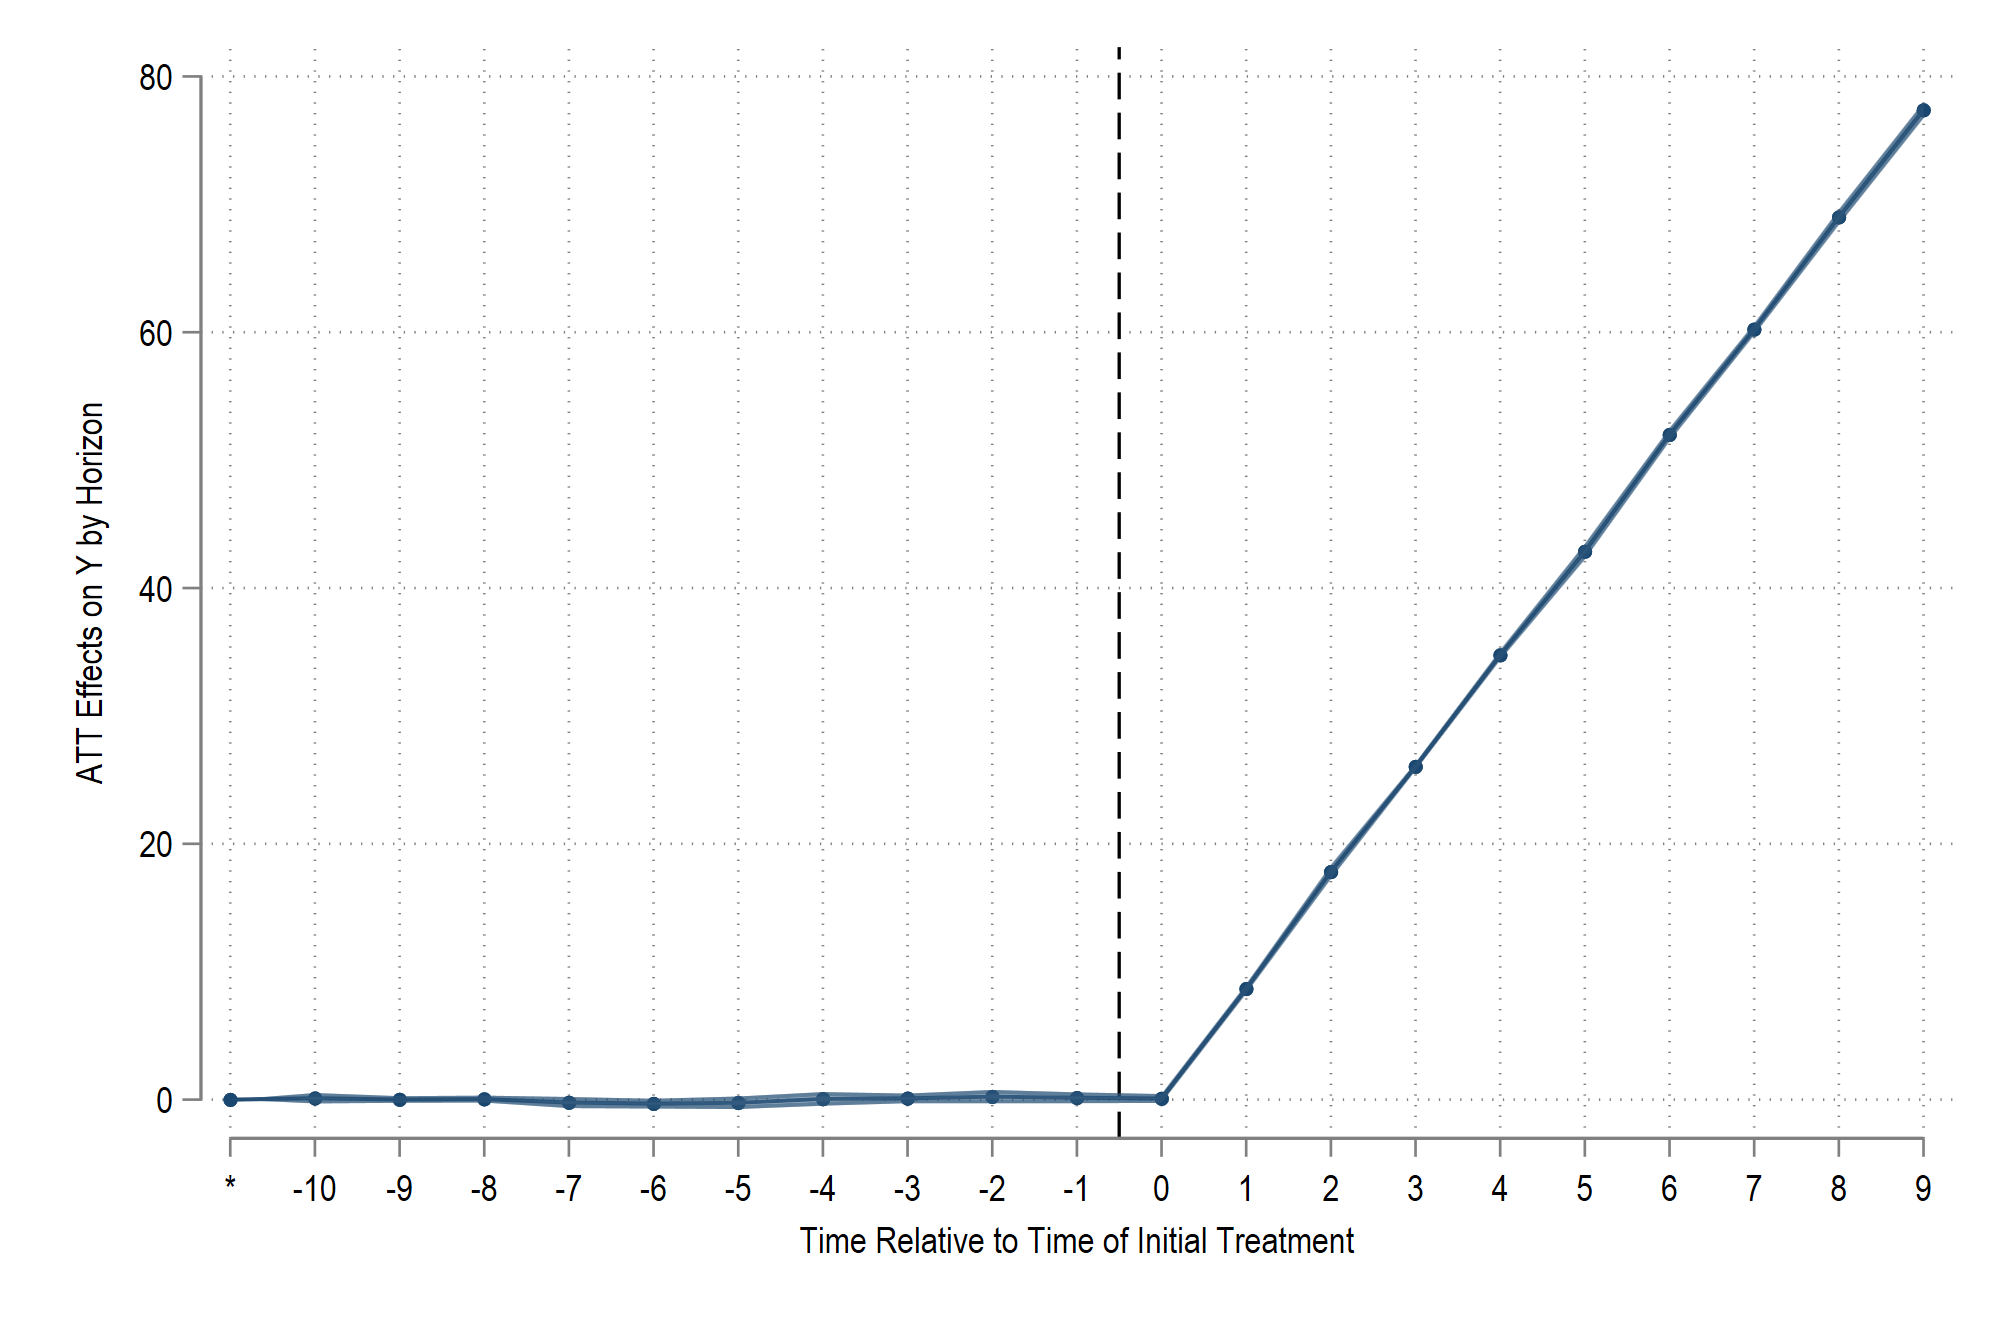
The near-zero pretrend ATT supports the visual pre-period flatness in the event-study output.
The command’s built-in graph option gives us: