wooldid
Table of contents
Notes
- Based on:
- Program version (if available): -
- Last checked: Nov 2024
Installation and options
ssc install wooldid, replace
Take a look at the help file:
help wooldid
Test the command
Please make sure that you generate the data using the script given here
Let’s try the basic wooldid command:
wooldid Y id t first_treat, cluster(id) makeplots espre(10) espost(10)
which will show this output:
Wooldid Estimation for Outcome: Y; Standard Errors: cluster(id)

N clusters = 30; N = 1800 (0 obs dropped from initial sample)
R2 = 0.9999;  R2adj = 0.9999; R2-within = 0.9998;  R2-withinadj = 0.9996


Main Results (Full Estimation Sample):

             |  estimate         se          t          p    lb_95ci    ub_95ci      relyr
-------------+----------------------------------------------------------------------------
main         |
         att |  131.3168   .1310143   1002.309   2.20e-67   131.0489   131.5848          .
-------------+----------------------------------------------------------------------------
pretreatment |
         att |  -.007817   .0903115  -.0865564    .931619  -.1925249   .1768908          .
-------------+----------------------------------------------------------------------------
ES_att       |
       pre10 |  .1113455   .1991685   .5590516   .5804185  -.2959998   .5186908        -10
        pre9 |   .010334   .1269376   .0814101   .9356751  -.2492825   .2699505         -9
        pre8 |  .0441961    .132331   .3339814   .7407968  -.2264512   .3148434         -8
        pre7 | -.2270929   .2125164   -1.06859   .2940691  -.6617378   .2075519         -7
        pre6 | -.3134442   .1873483  -1.673056   .1050718  -.6966146   .0697262         -6
        pre5 | -.2442293   .2393161   -1.02053   .3159158  -.7336857   .2452272         -5
        pre4 |  .0592312   .2598119   .2279771   .8212638  -.4721439   .5906063         -4
        pre3 |  .1010662   .1838977   .5495784   .5868163  -.2750468   .4771791         -3
        pre2 |  .2354845    .256337   .9186517   .3658558  -.2887837   .7597526         -2
        pre1 |  .1449385    .205954   .7037422   .4872058  -.2762847   .5661618         -1
     contemp |  .0880106   .1690873   .5205039   .6066639  -.2578117   .4338329          0
       post1 |  8.668803   .1773712    48.8738   2.07e-29   8.306039   9.031568          1
       post2 |  17.81067   .2636722   67.54853   1.88e-33    17.2714   18.34994          2
       post3 |  26.04074   .1457741   178.6376   1.15e-45    25.7426   26.33888          3
       post4 |  34.75516   .1880117   184.8564   4.25e-46   34.37064   35.13969          4
       post5 |  42.85557   .2933104     146.11   3.87e-43   42.25569   43.45546          5
       post6 |  51.99085   .2483759   209.3233   1.16e-47   51.48287   52.49884          6
       post7 |   60.2264   .2170374   277.4932   3.27e-51   59.78251    60.6703          7
       post8 |  68.99828   .2877645   239.7734   2.26e-49   68.40973   69.58682          8
       post9 |     77.37   .3005877   257.3958   2.90e-50   76.75523   77.98477          9
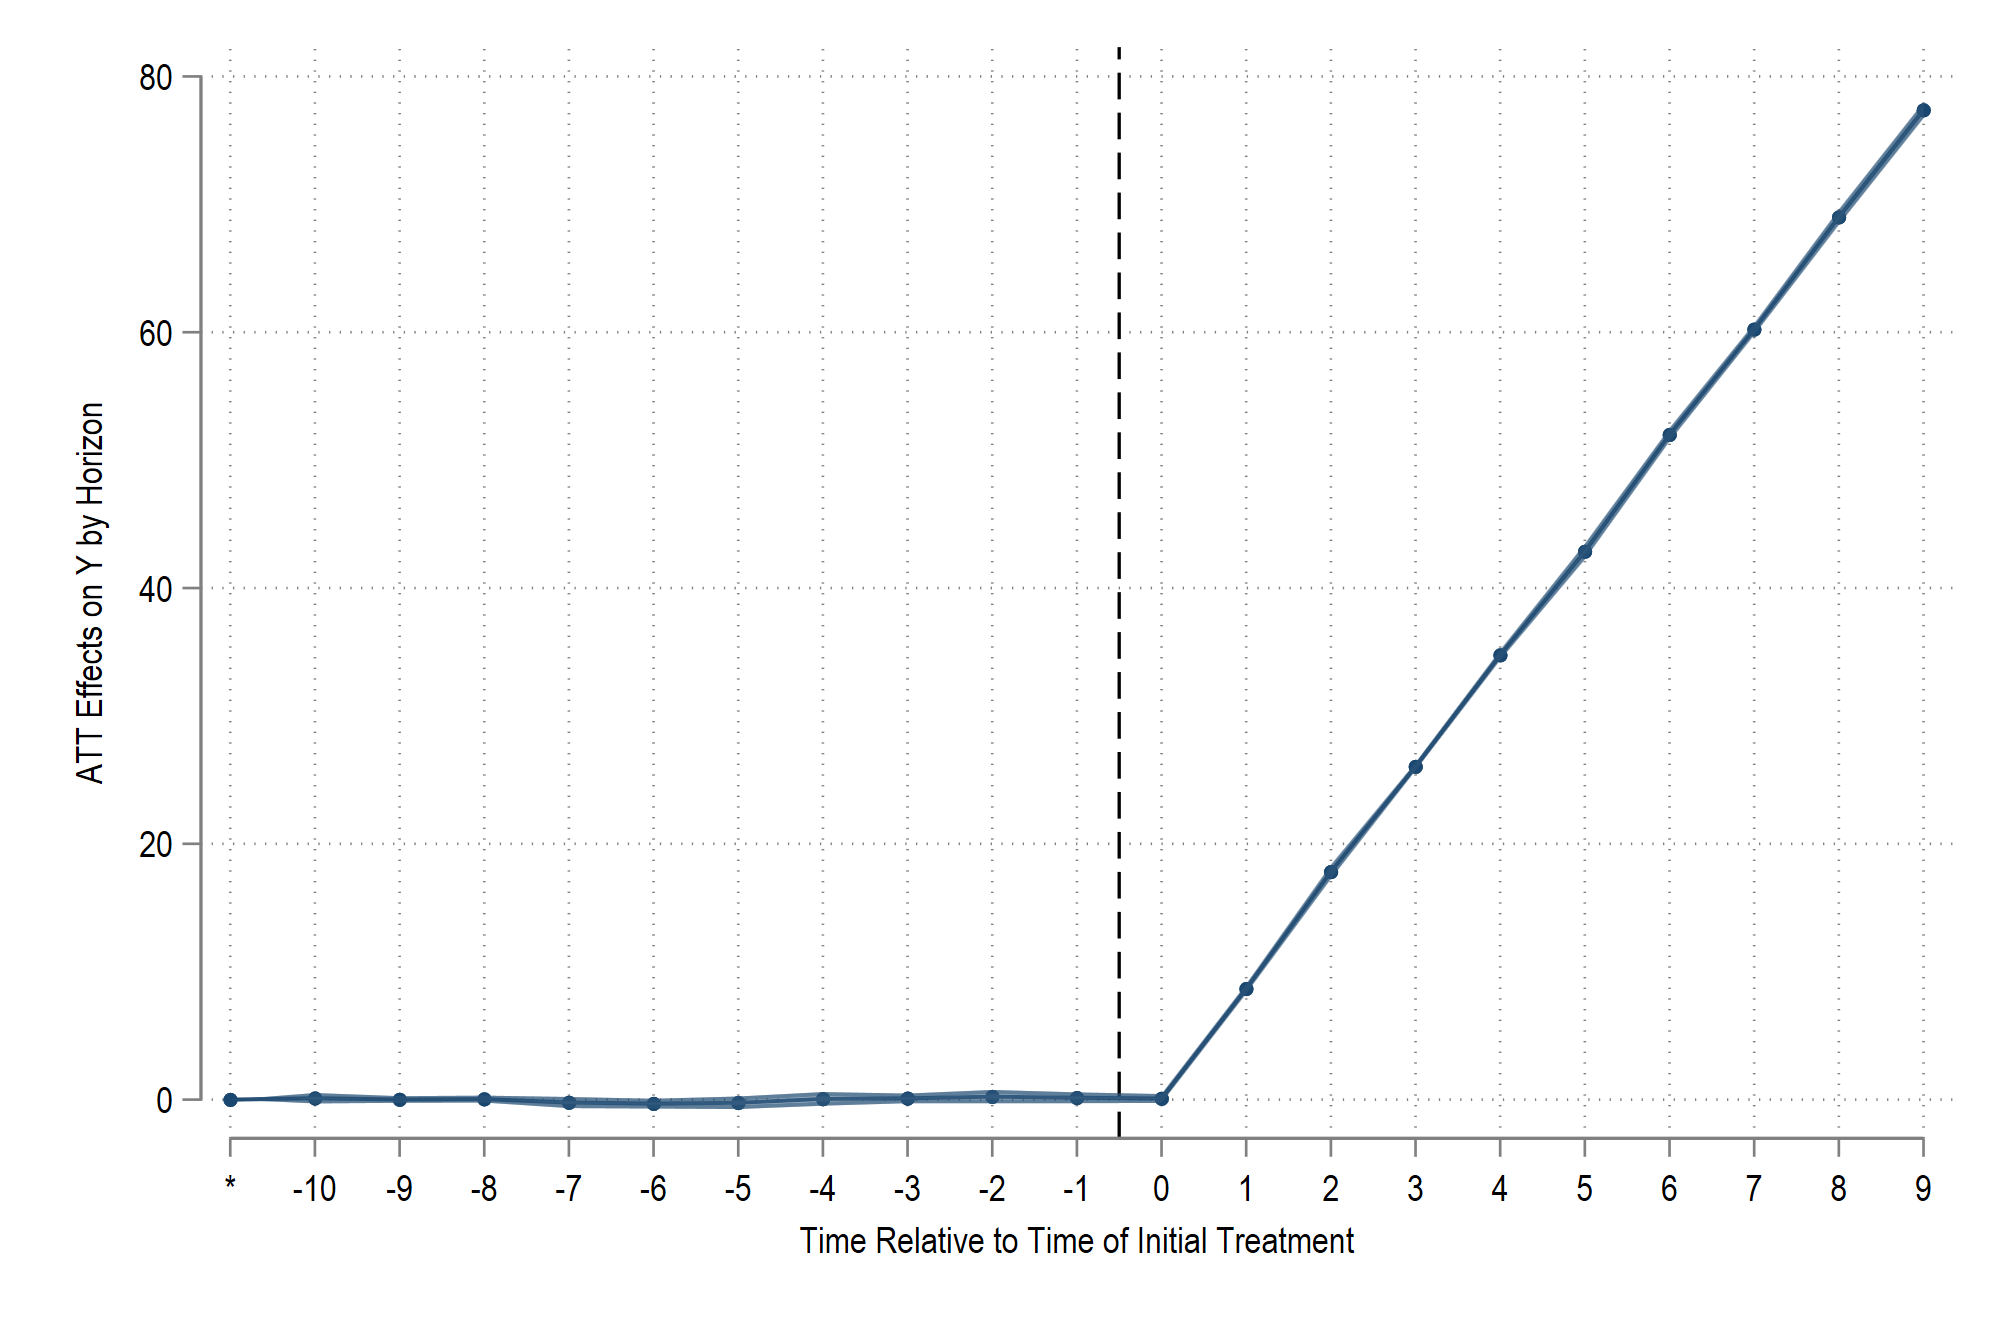
The command’s built-in graph option gives us: