Stata
Advanced Stata visualizations, reproducible workflows, and training for applied research and policy analysis.
I have been using Stata since 2004. However, it was only during the COVID-19 lockdowns in Vienna in 2020 that I began to seriously explore advanced data visualization as a tool for tracking and communicating complex topics such as the spread of the virus. In August 2020, I launched the Stata Guide on Medium to systematically document scripts, workflows, and design principles for producing a wide range of visualizations in Stata. The objective was twofold:
- to consolidate an expanding collection of code snippets into coherent guides, and
- to transparently document the full process behind each visualization so that others could easily replicate and adapt them.
The guides gained substantial traction on social media and within the Stata community. At the same time, a constant feedback I was getting was that while the guides were useful for learning, setting up several hundred lines of code for a single visualization was not practical for many users. What users wanted were streamlined, well-documented packages that could be run directly from the command line, with sensible defaults and customization options.
In early 2021, I therefore began converting the guides into fully documented Stata packages. As of the latest update to this page, I have released more than 25 packages. The figure below shows the cumulative release history across packages on GitHub:

Developing these packages was itself an intensive learning process, as development, Mata programming, and maintenance were new to me. While this work temporarily shifted my focus away from writing long-form guides, it substantially deepened my understanding of Stata’s programming structure and led to extensive interaction with researchers, policy analysts, international organizations, and practitioners. These exchanges have been, and continue to be, one of the most rewarding aspects of the work.
Releasing software packages into the public domain is, in many ways, similar to publishing an academic paper, but with one important difference. While papers are largely static once published, packages are subject to continuous ex-post peer review. Users identify bugs, request features, and stress-test commands in ways that are difficult to anticipate ex ante. Over time, this has led to systematic improvements across packages. For example, the addition of support for weights, label wrapping, and more robust defaults. With more than 25 packages, this ongoing maintenance represents a substantial time investment, including updating help files, maintaining GitHub pages, writing release notes, and producing example figures. Currently, the most widely-used packages are in a very solid place, offering a broad set of features that accommodates diverse use cases. Several of the visualizations generated by these packages have also appeared in articles and blogs, although formal package citations remain rare (hint hint :)).
I do plan to actively return to blogging, with a focus on distilling and reflecting on the knowledge accumulated over the past few years. Even in its current, relatively dormant state, the Stata Guide on Medium hosts more than 60 articles, many of which remain relevant for learning visualization techniques and general Stata programming. In addition, I maintain the Stata Gallery on Medium, a community-driven space where users contribute their own visualization guides. So please contribute!
Workshops and presentations
I regularly present my Stata-related work at conferences and professional events. One example is the Advanced Visualizations with Stata series, which introduces new packages and discusses emerging visualization techniques within the Stata ecosystem.
I also conduct workshops and seminars on a regular basis. Many of these are open to the public and organized in collaboration with Stata UK and DPC Software.
In addition, I have delivered tailored workshops directly for universities and other institutions. If you are interested in organizing a workshop or seminar, please feel free to get in touch.
")
")
Client engagement
I also work directly with clients. This includes multilateral organizations, ministries, and universities where most of the requests are for data workflows, complex analytical pipelines, custom extensions of existing visualization packages, and the production of publication-ready graphics for articles, reports, and policy documents.
While this type of engagement was not originally planned, several projects were too exciting to decline. Such collaborations also frequently coincide with intensive development phases, during which packages receive substantial upgrades and refinements. If you are seeking support for a larger analytical or visualization project, please feel free to reach out.
Portfolio and packages
You can browse examples of my work in the StataViz Portfolio or follow my social media accounts for updates on new releases and workshops.
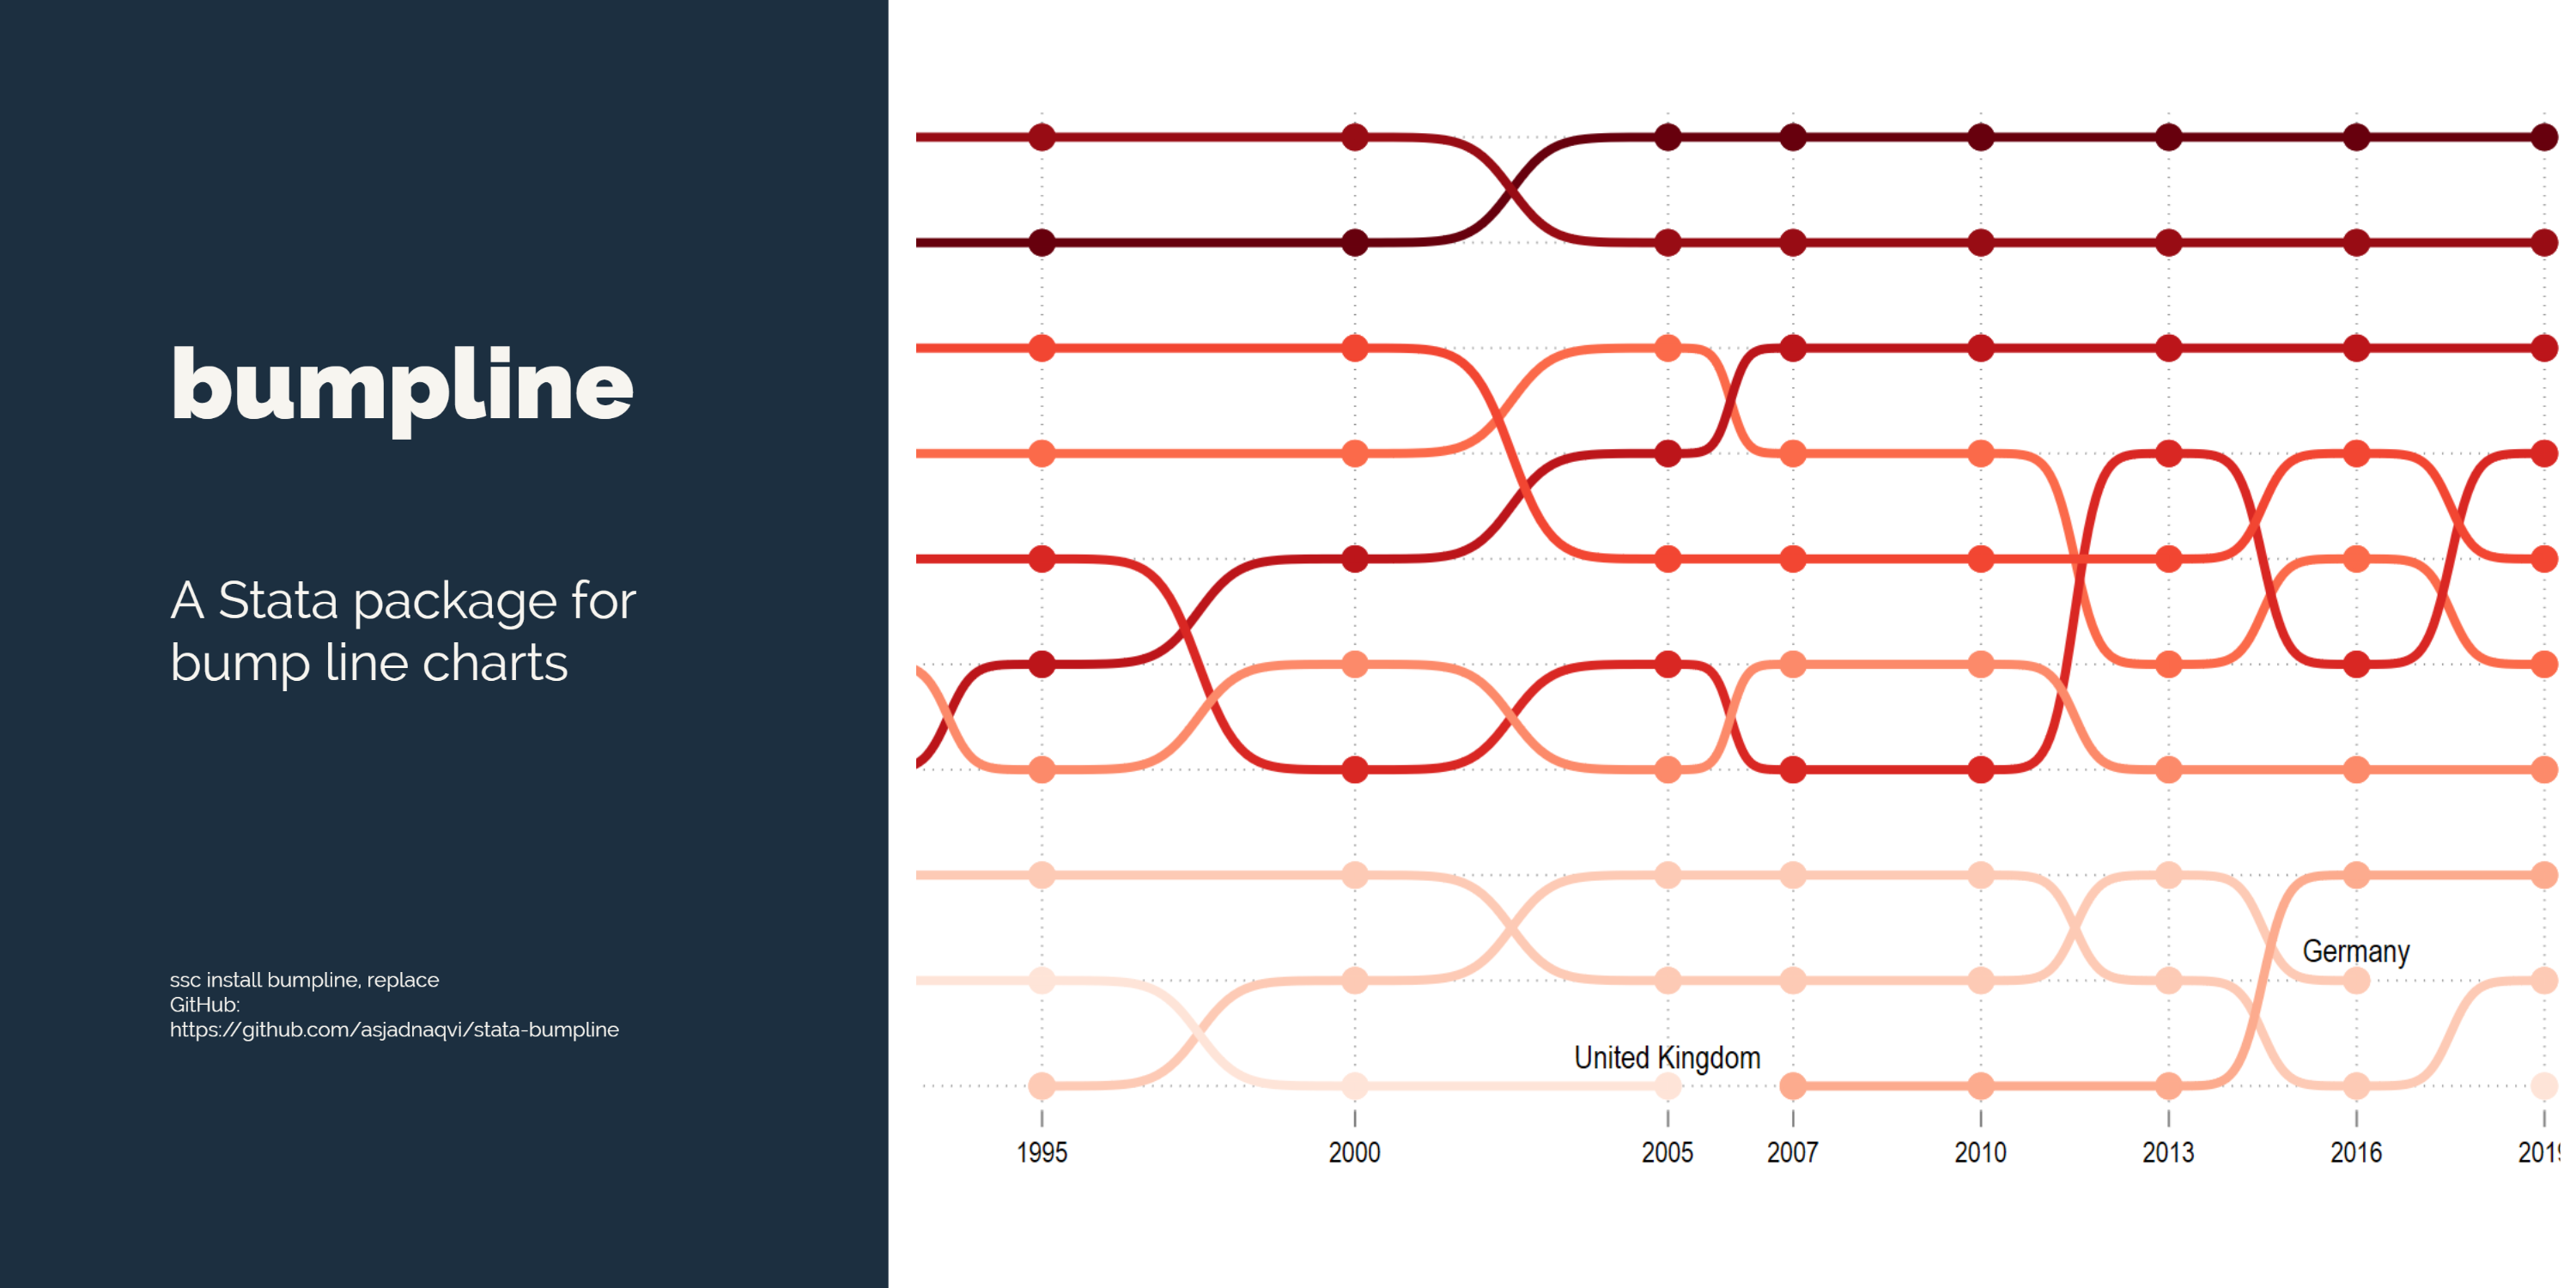
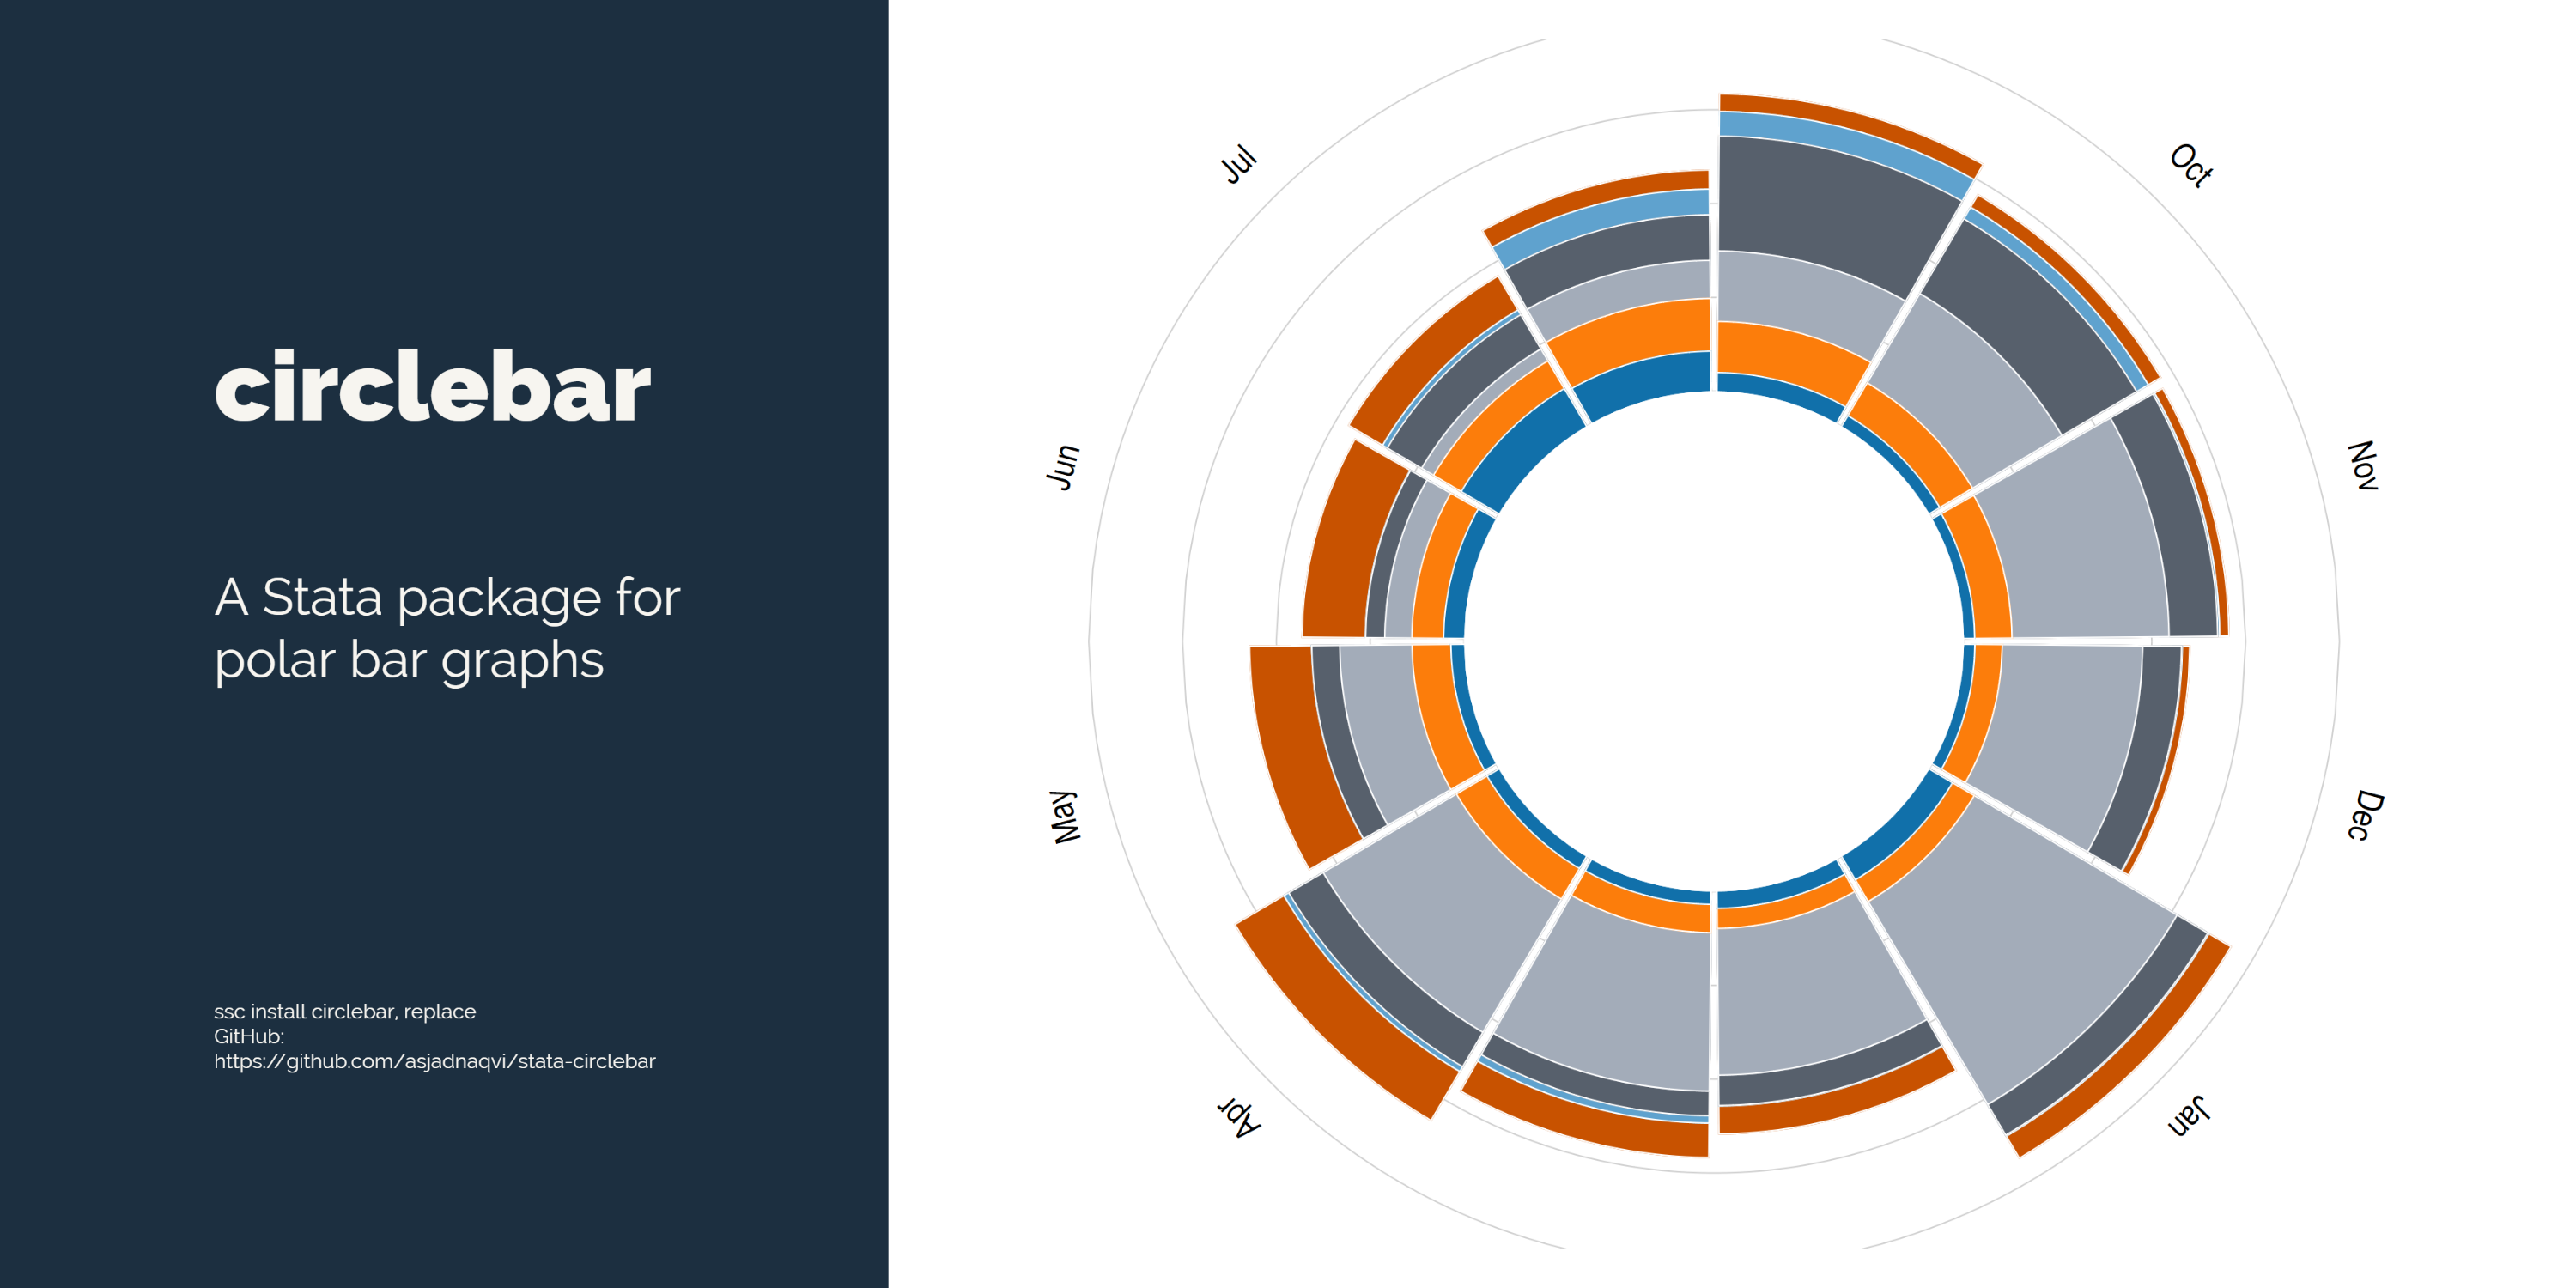
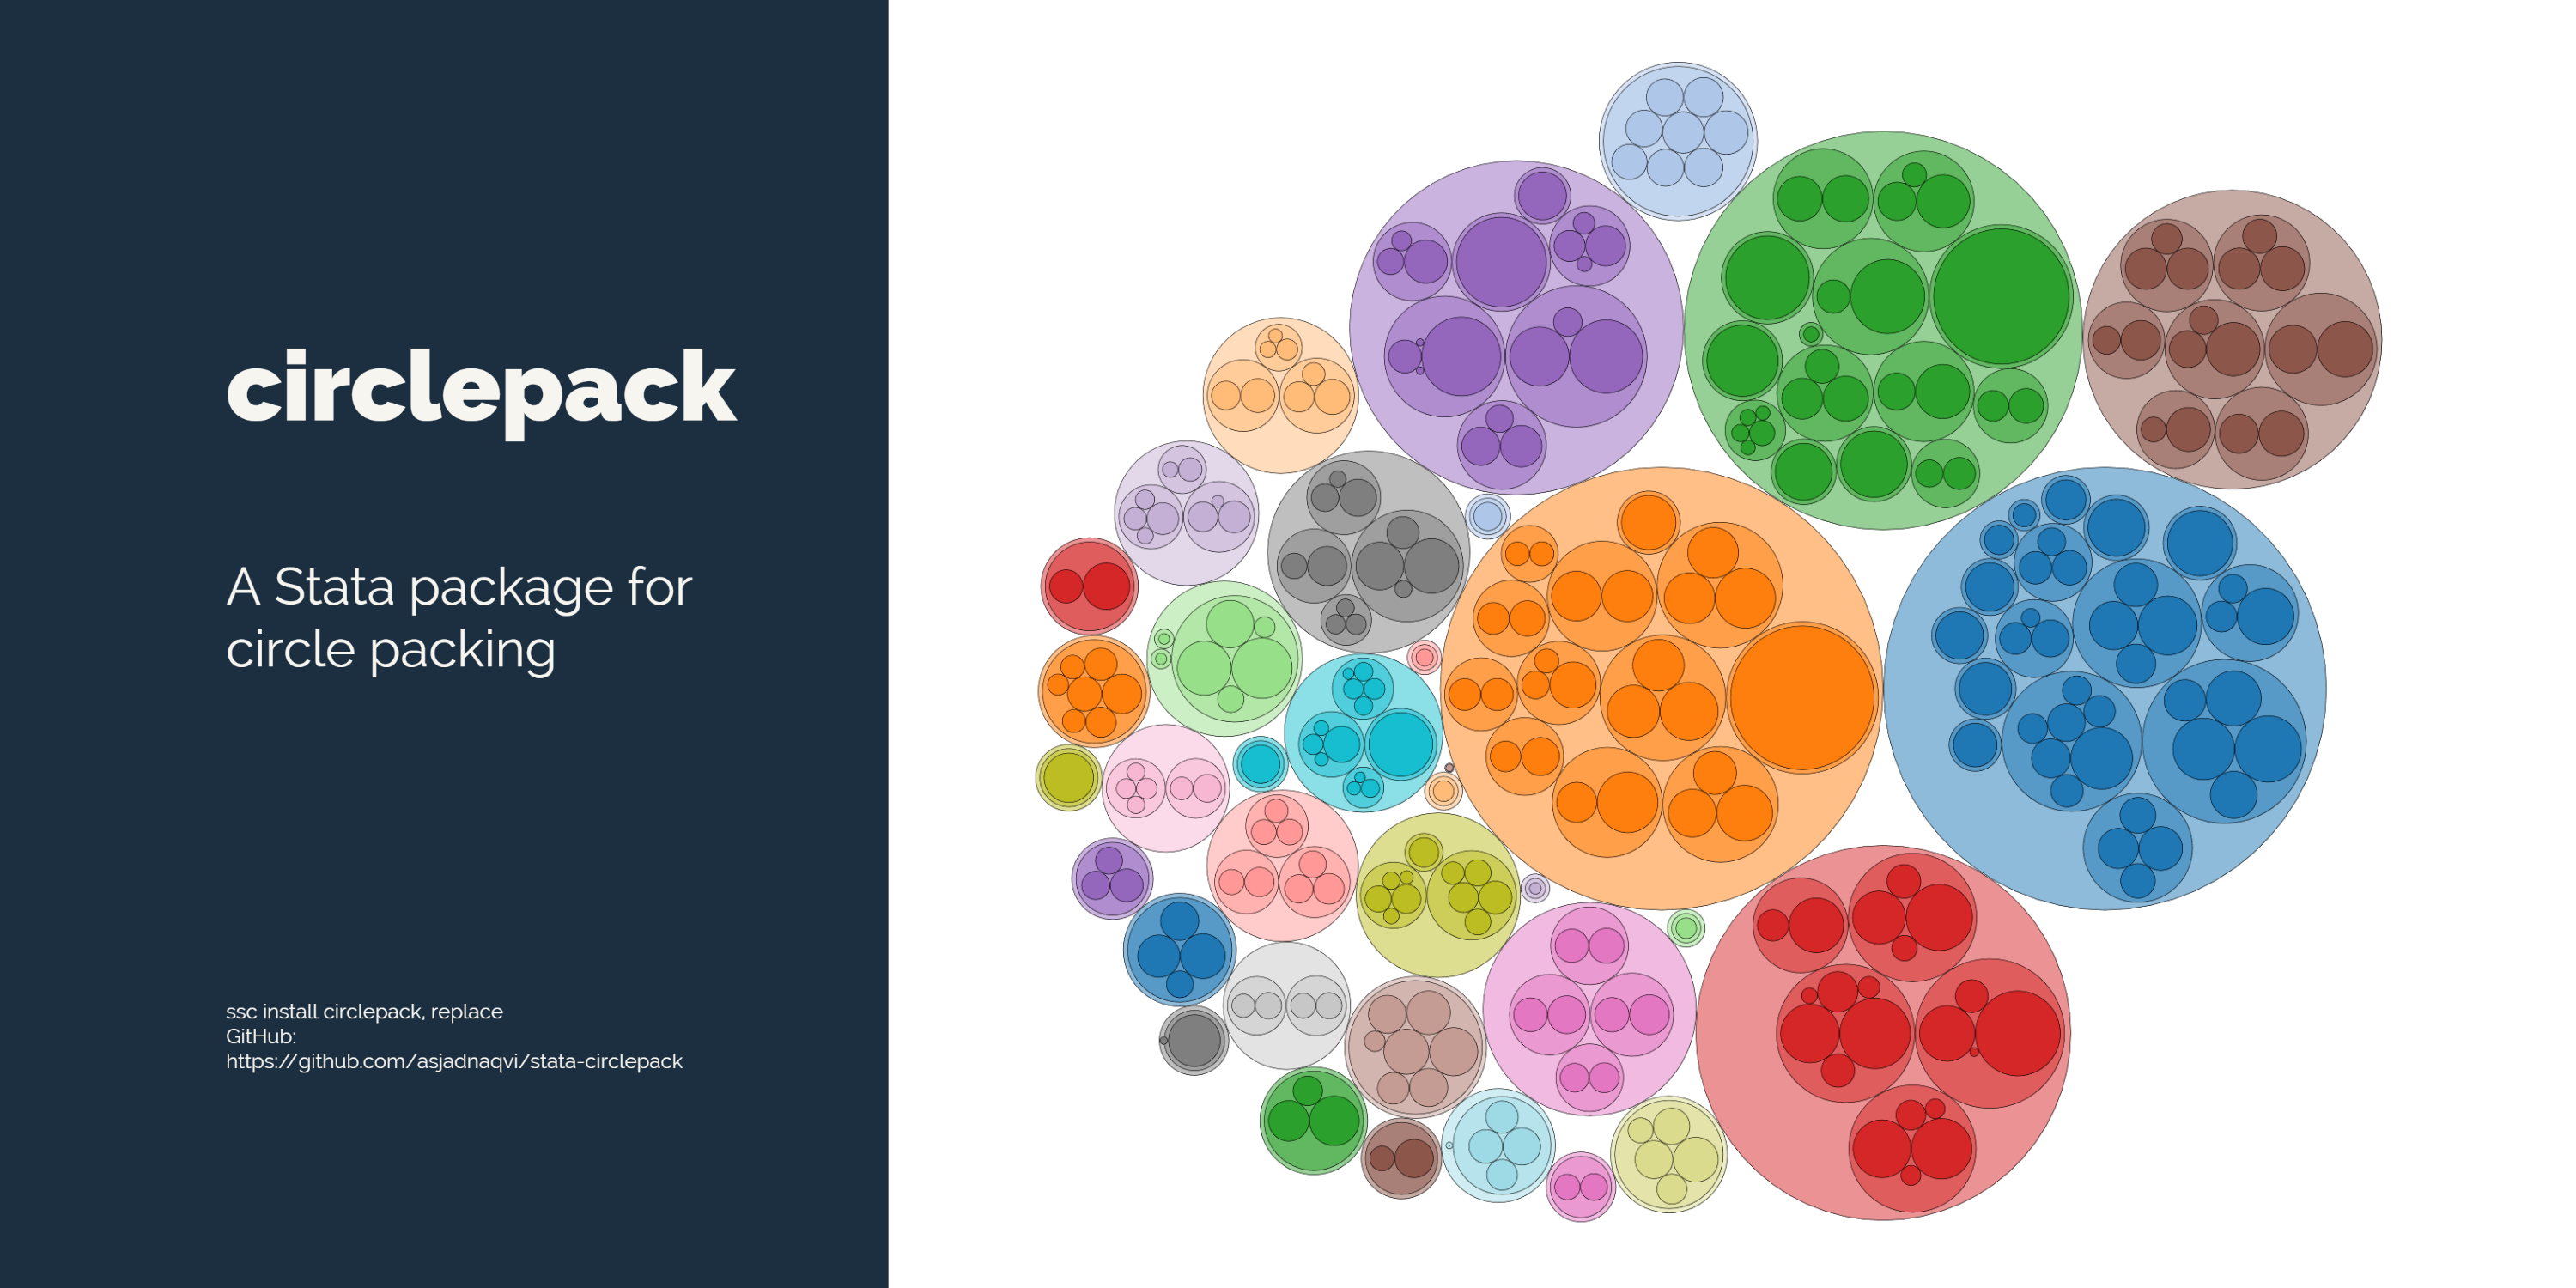
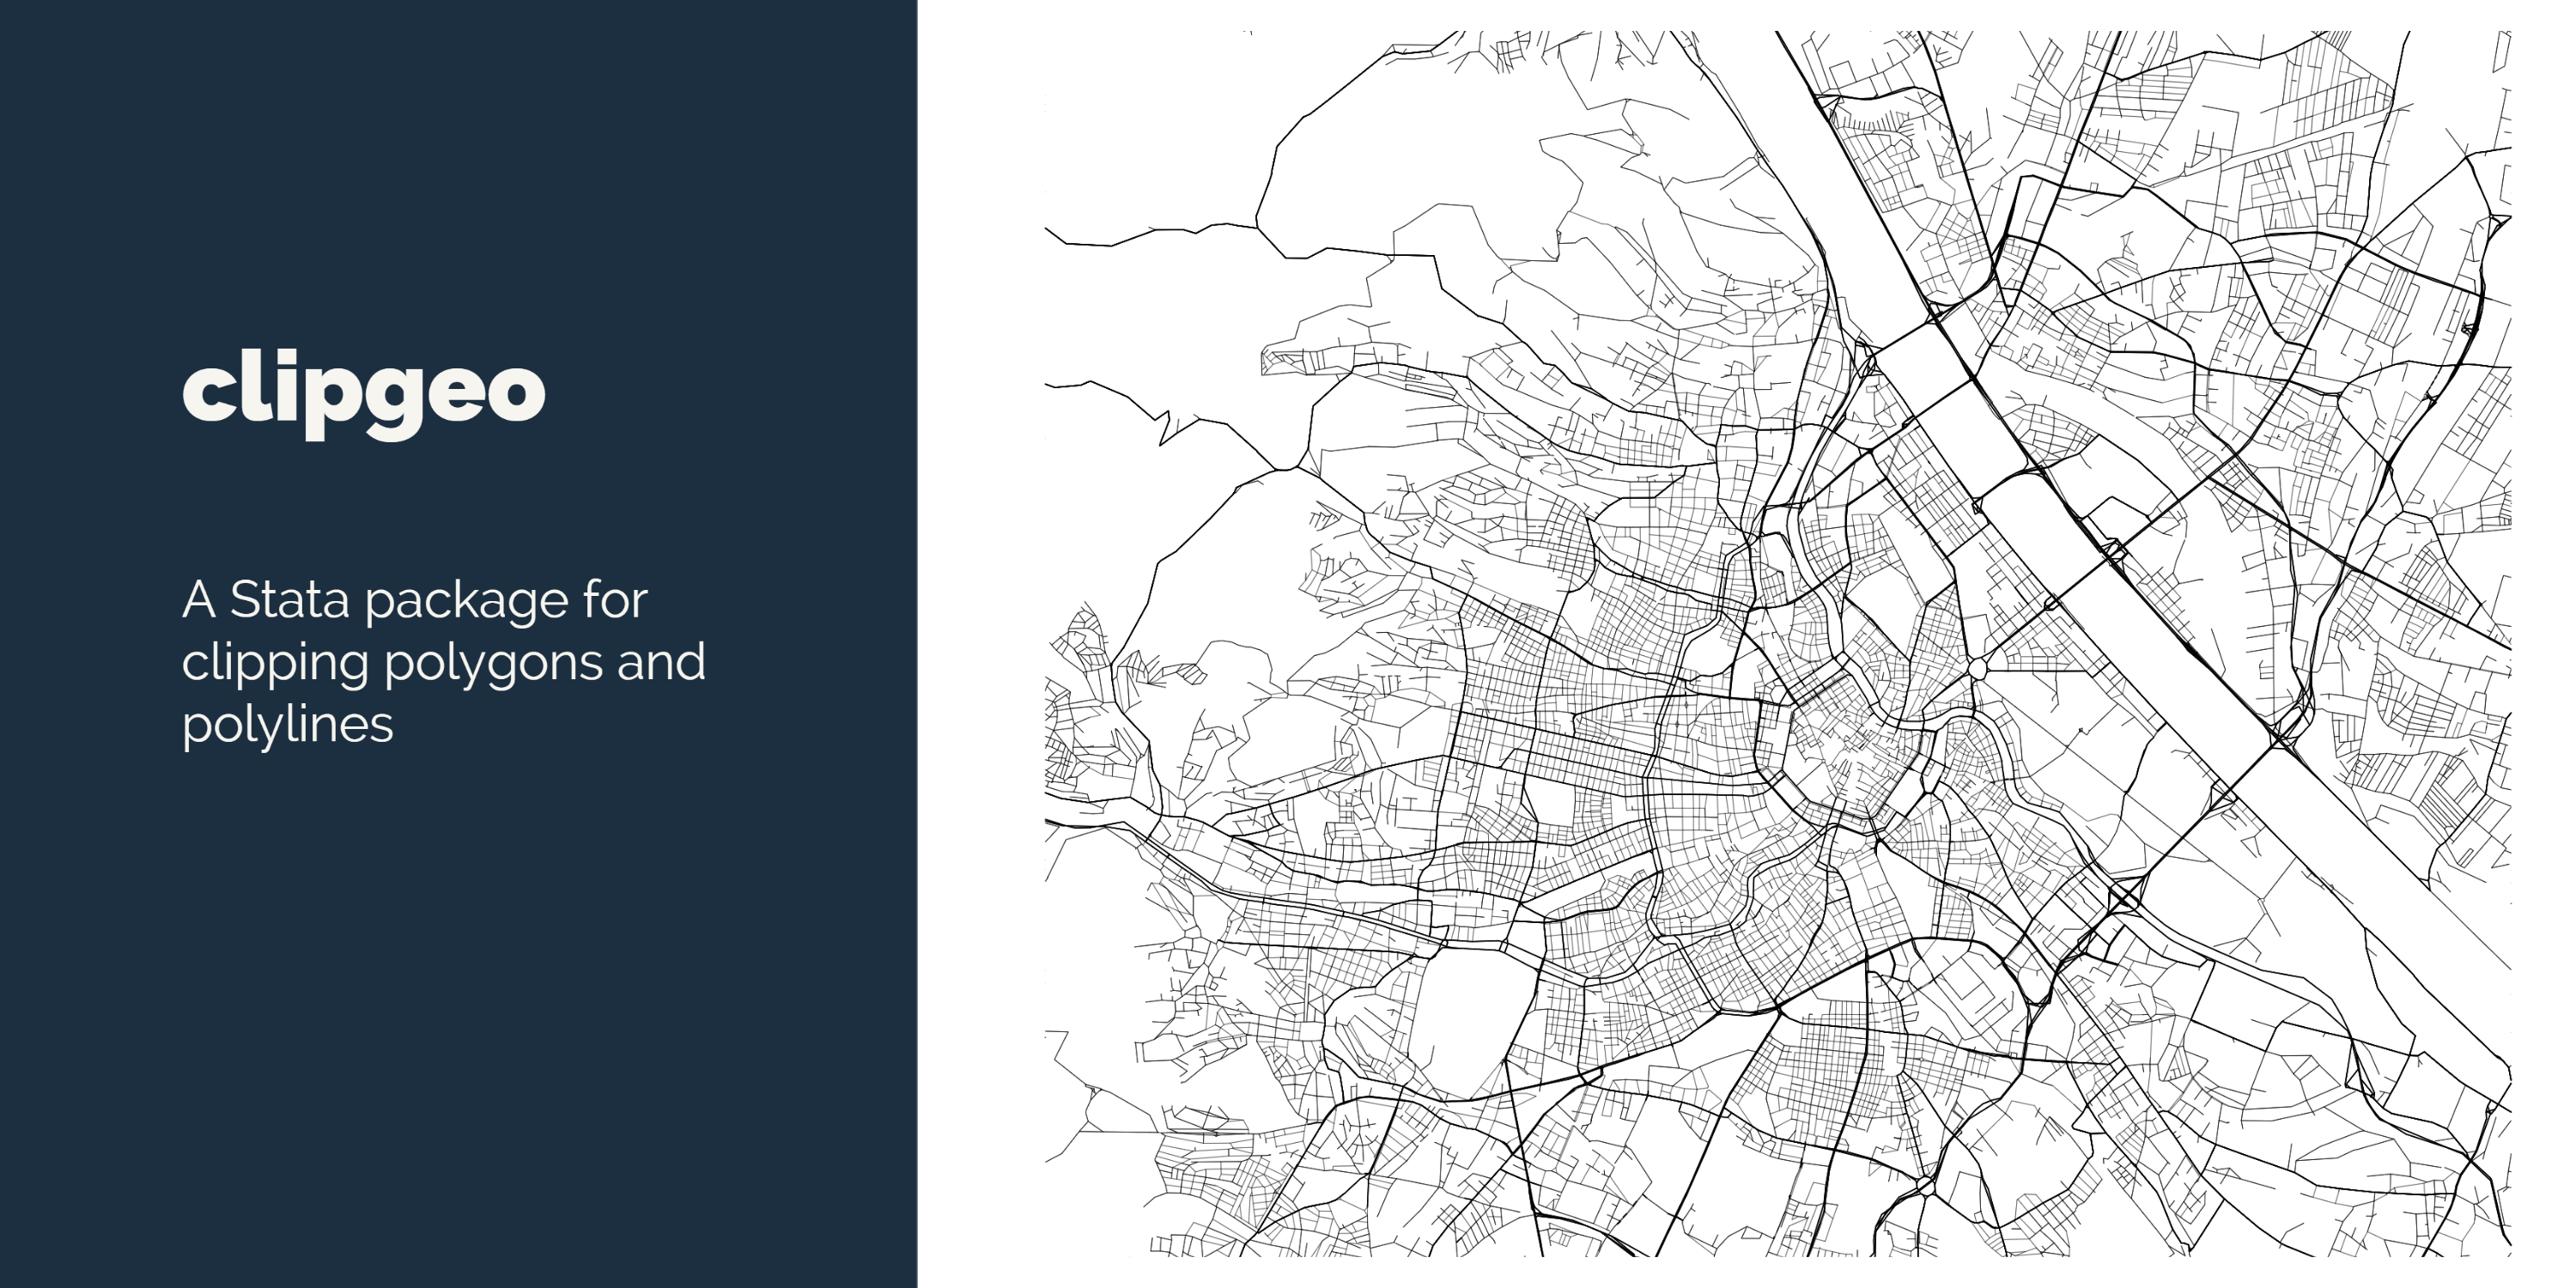
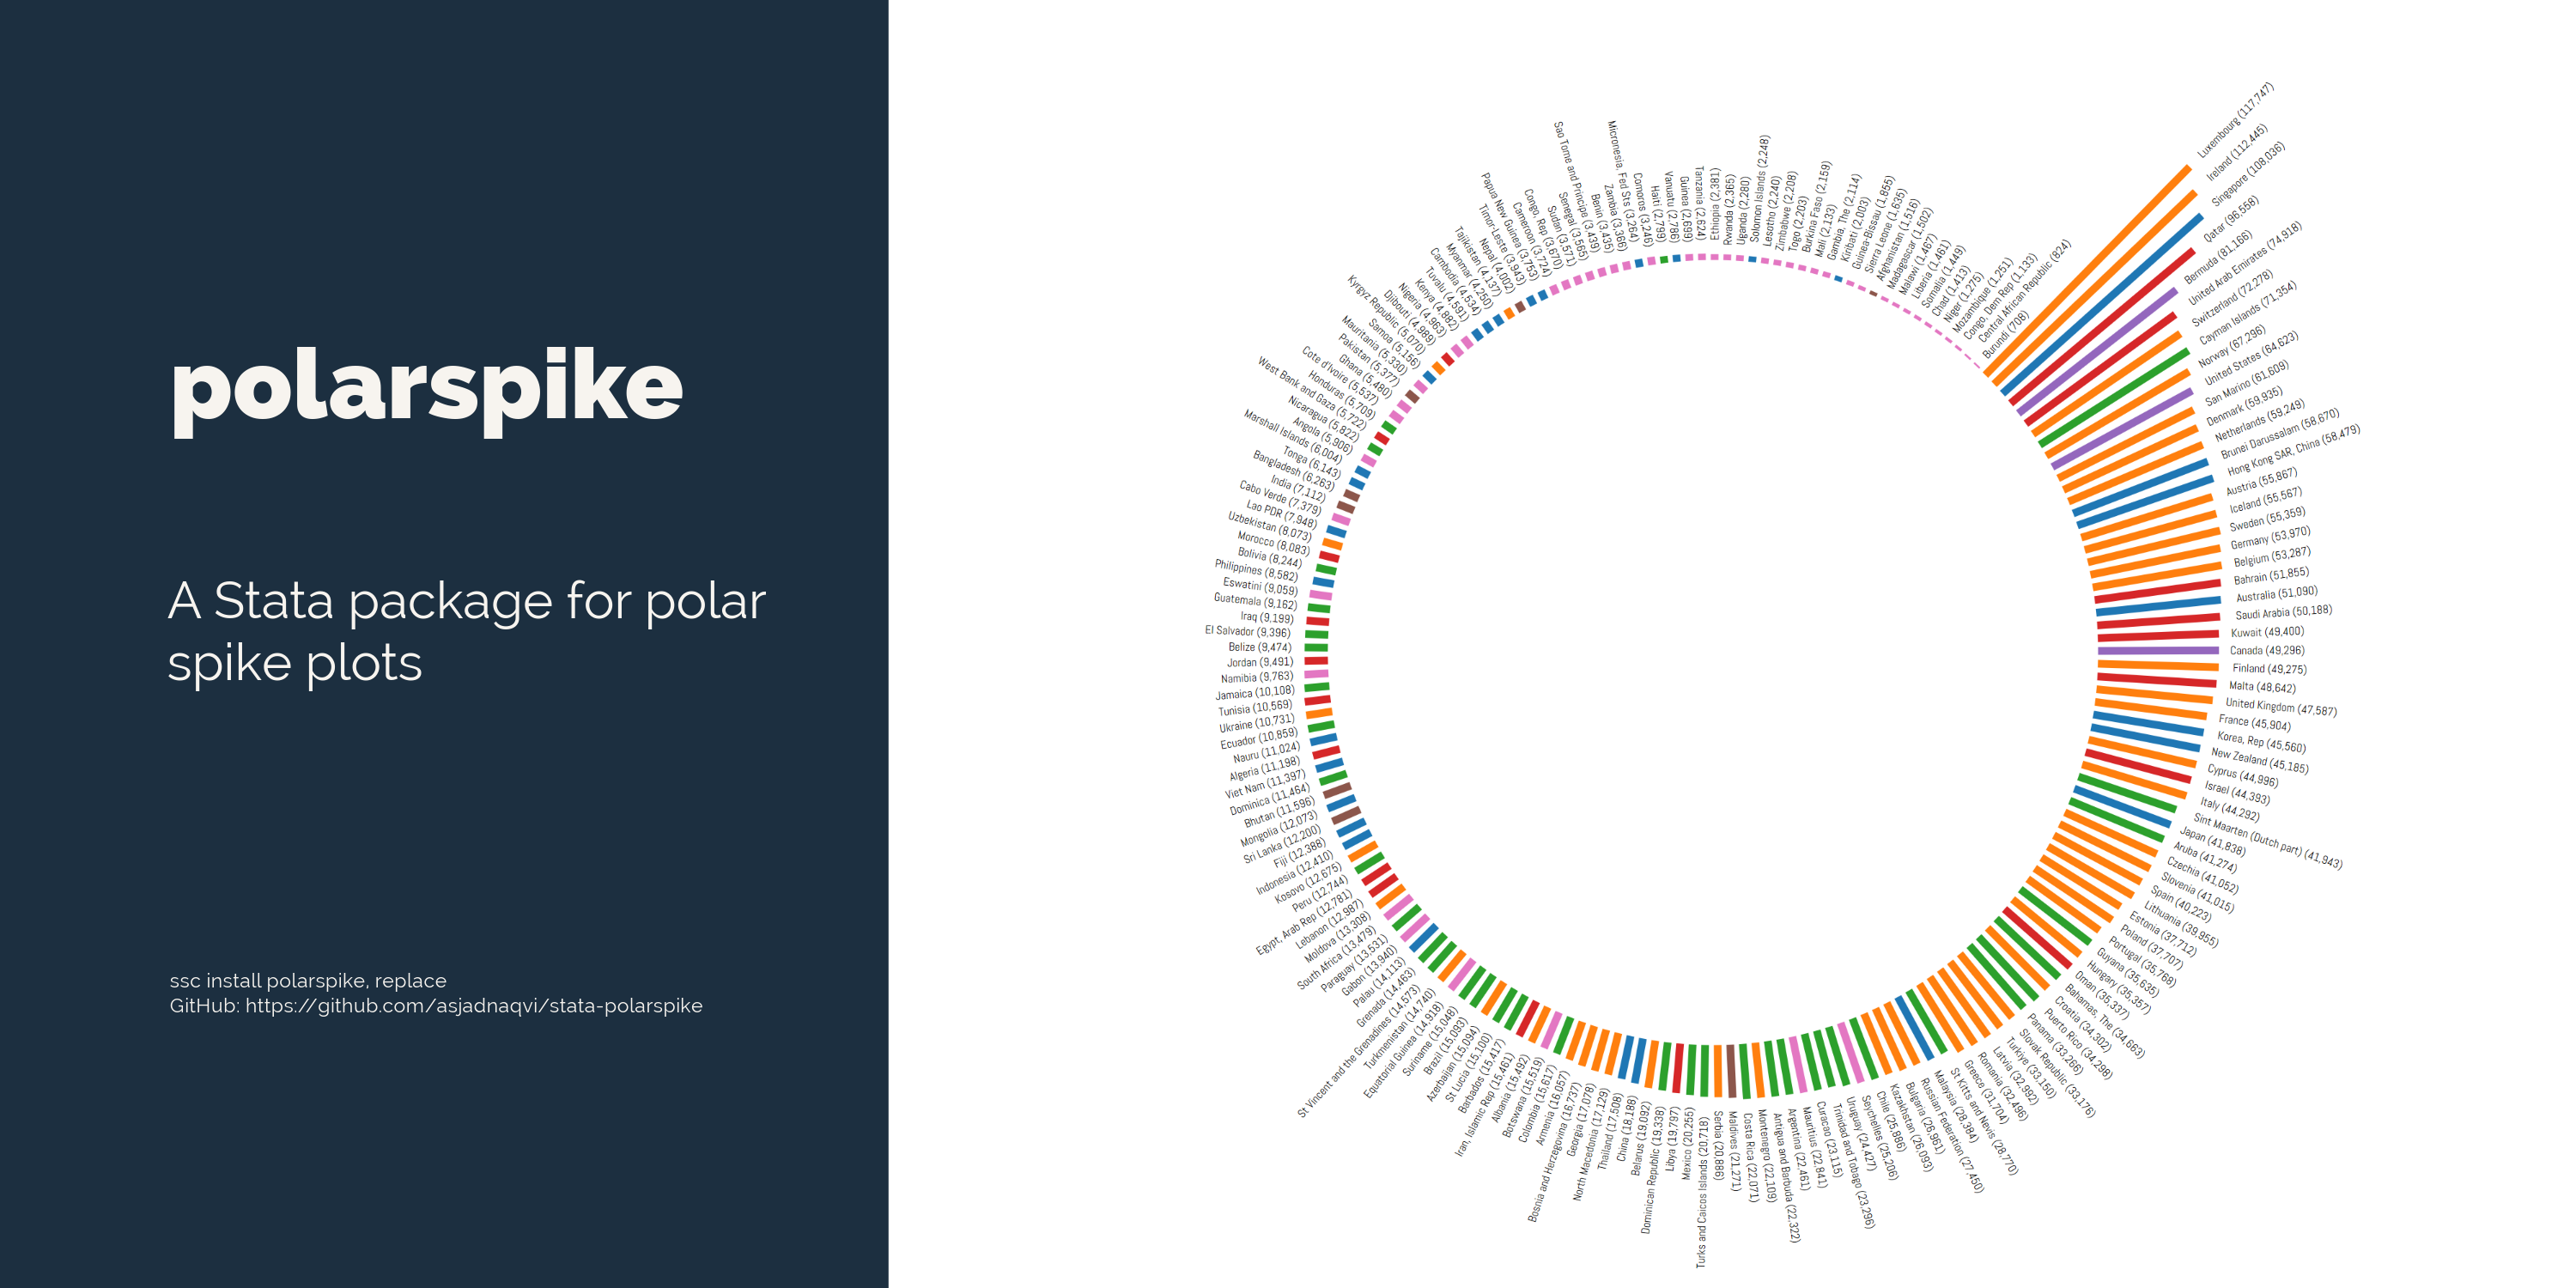
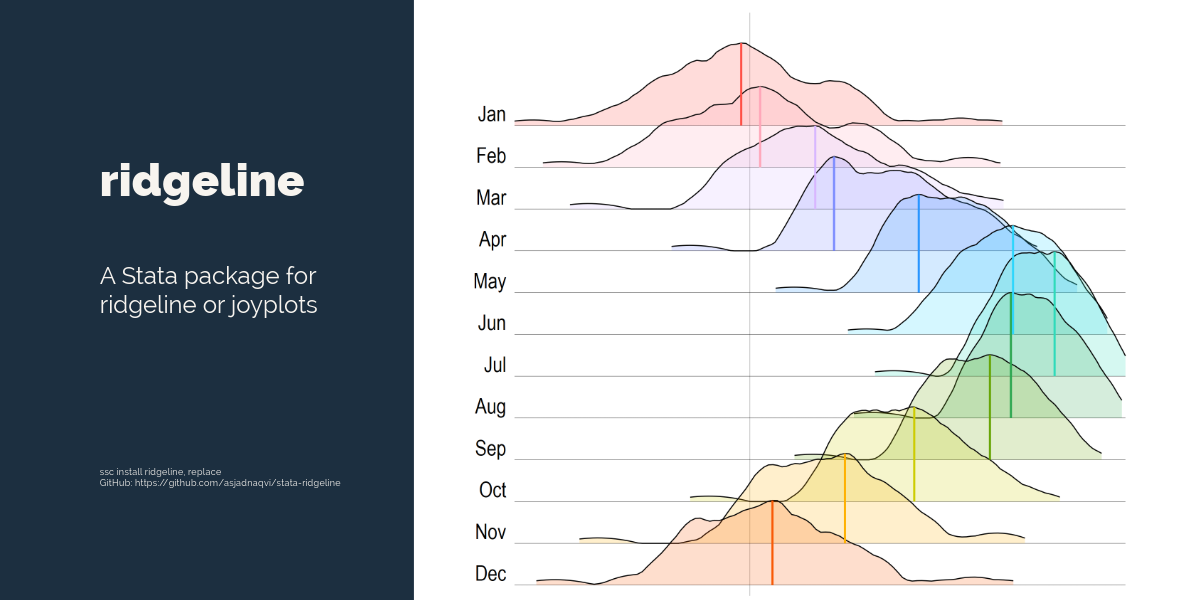
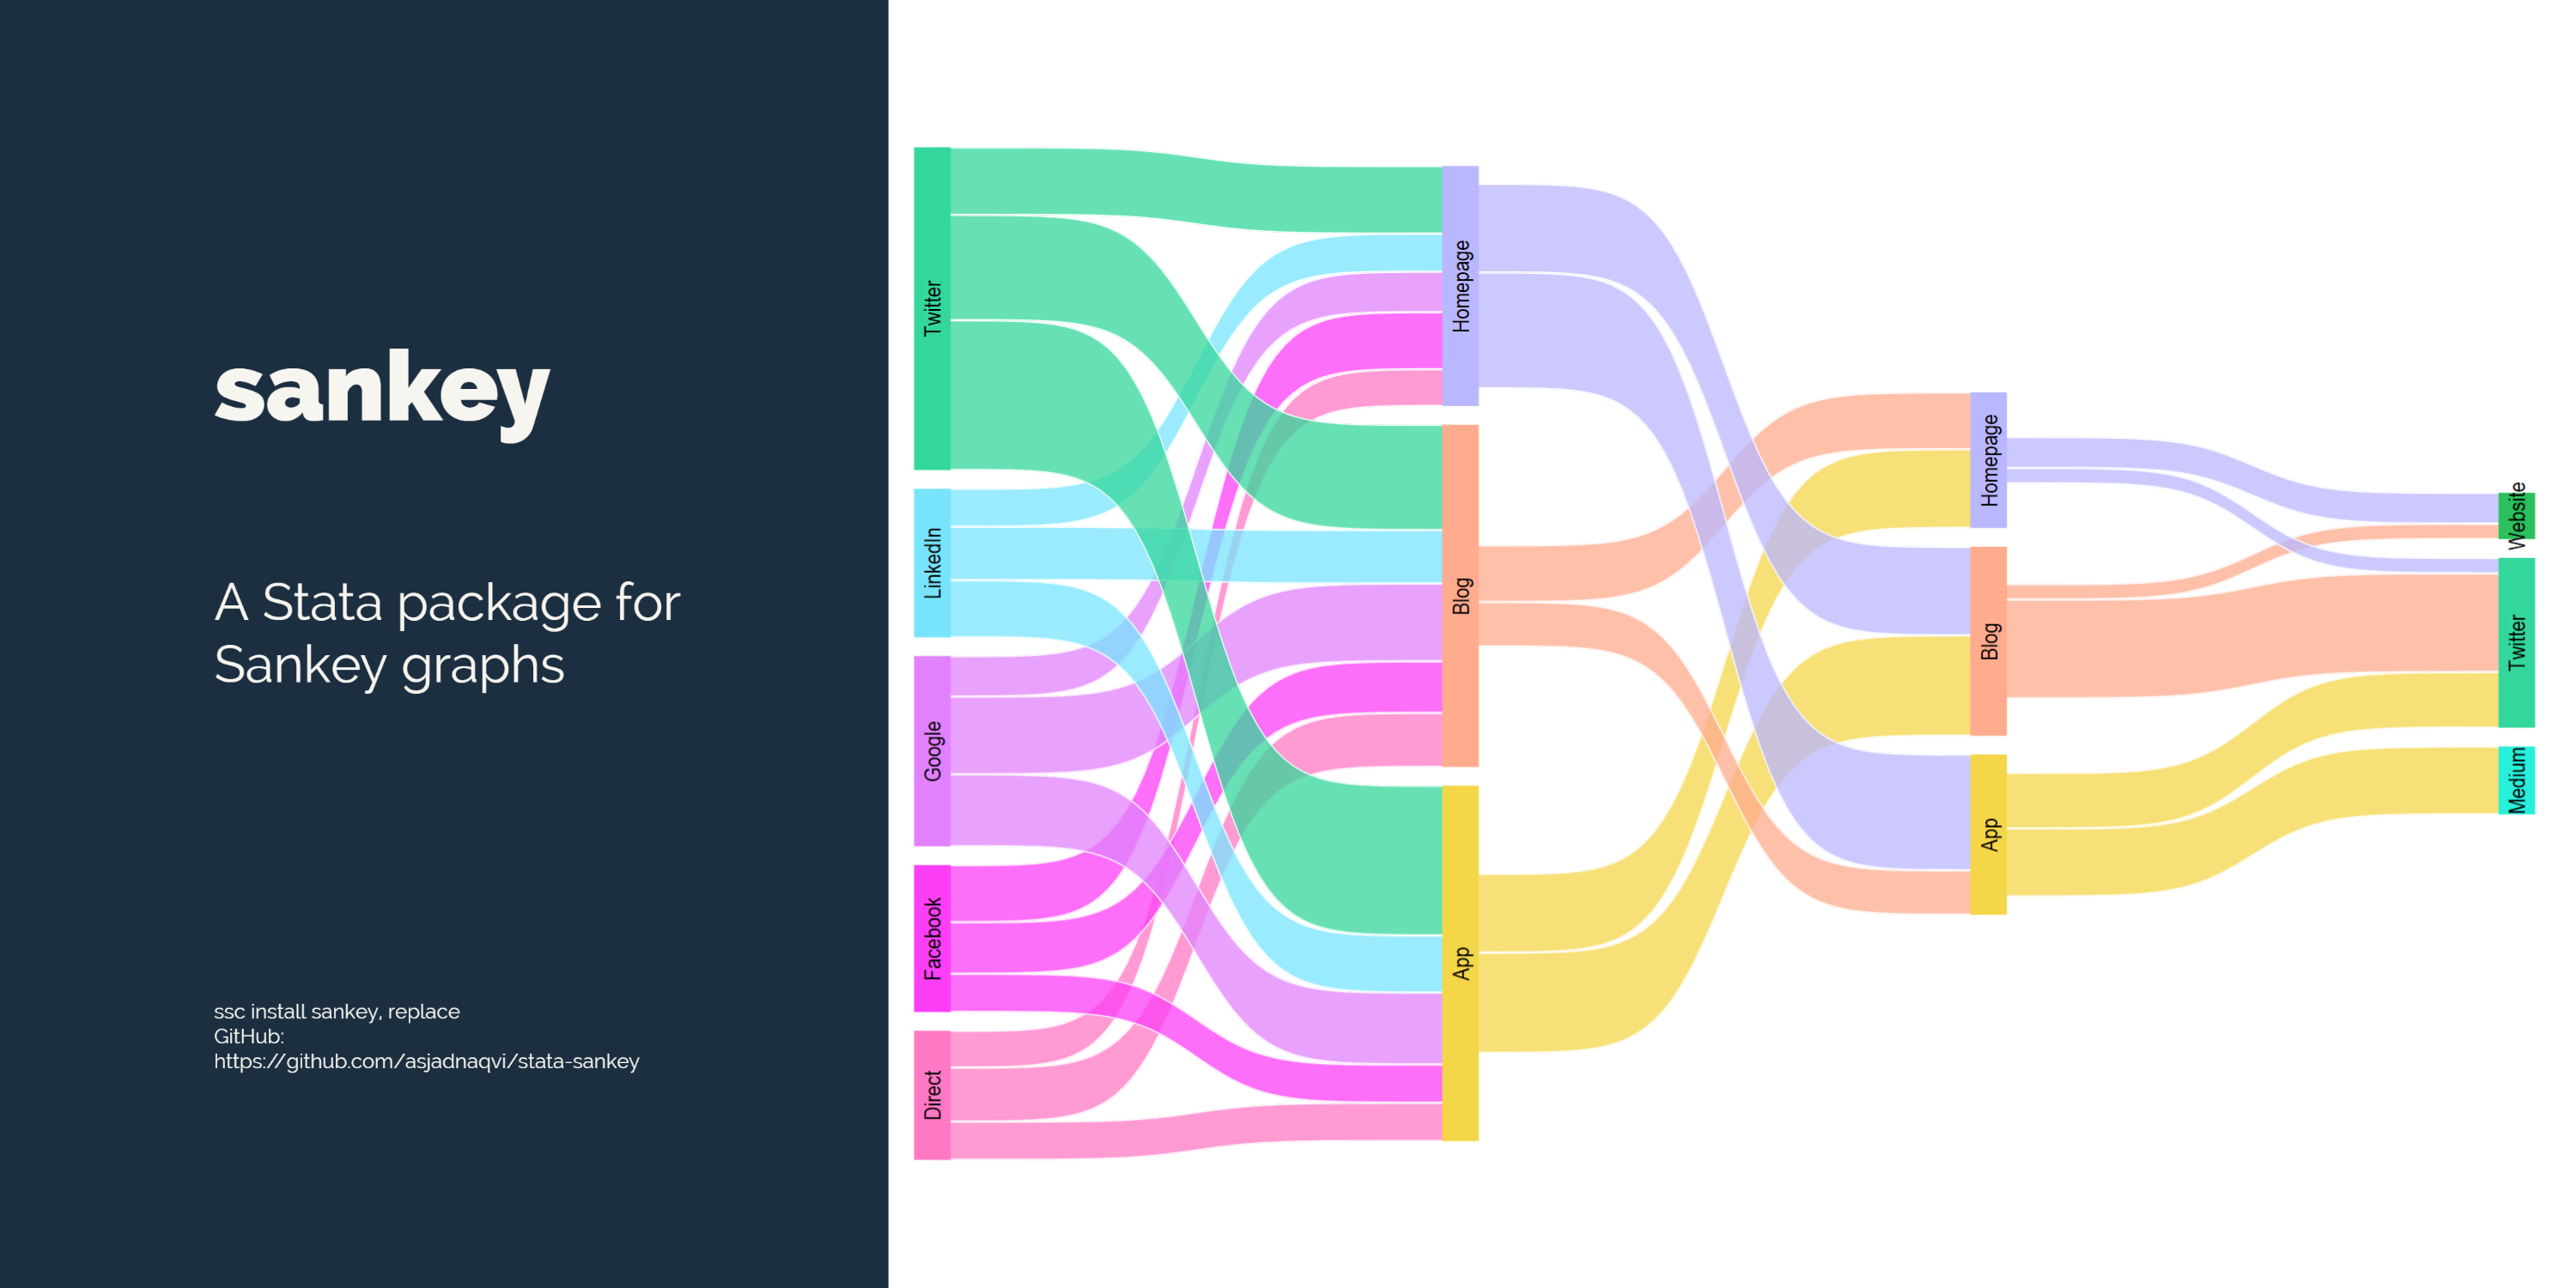
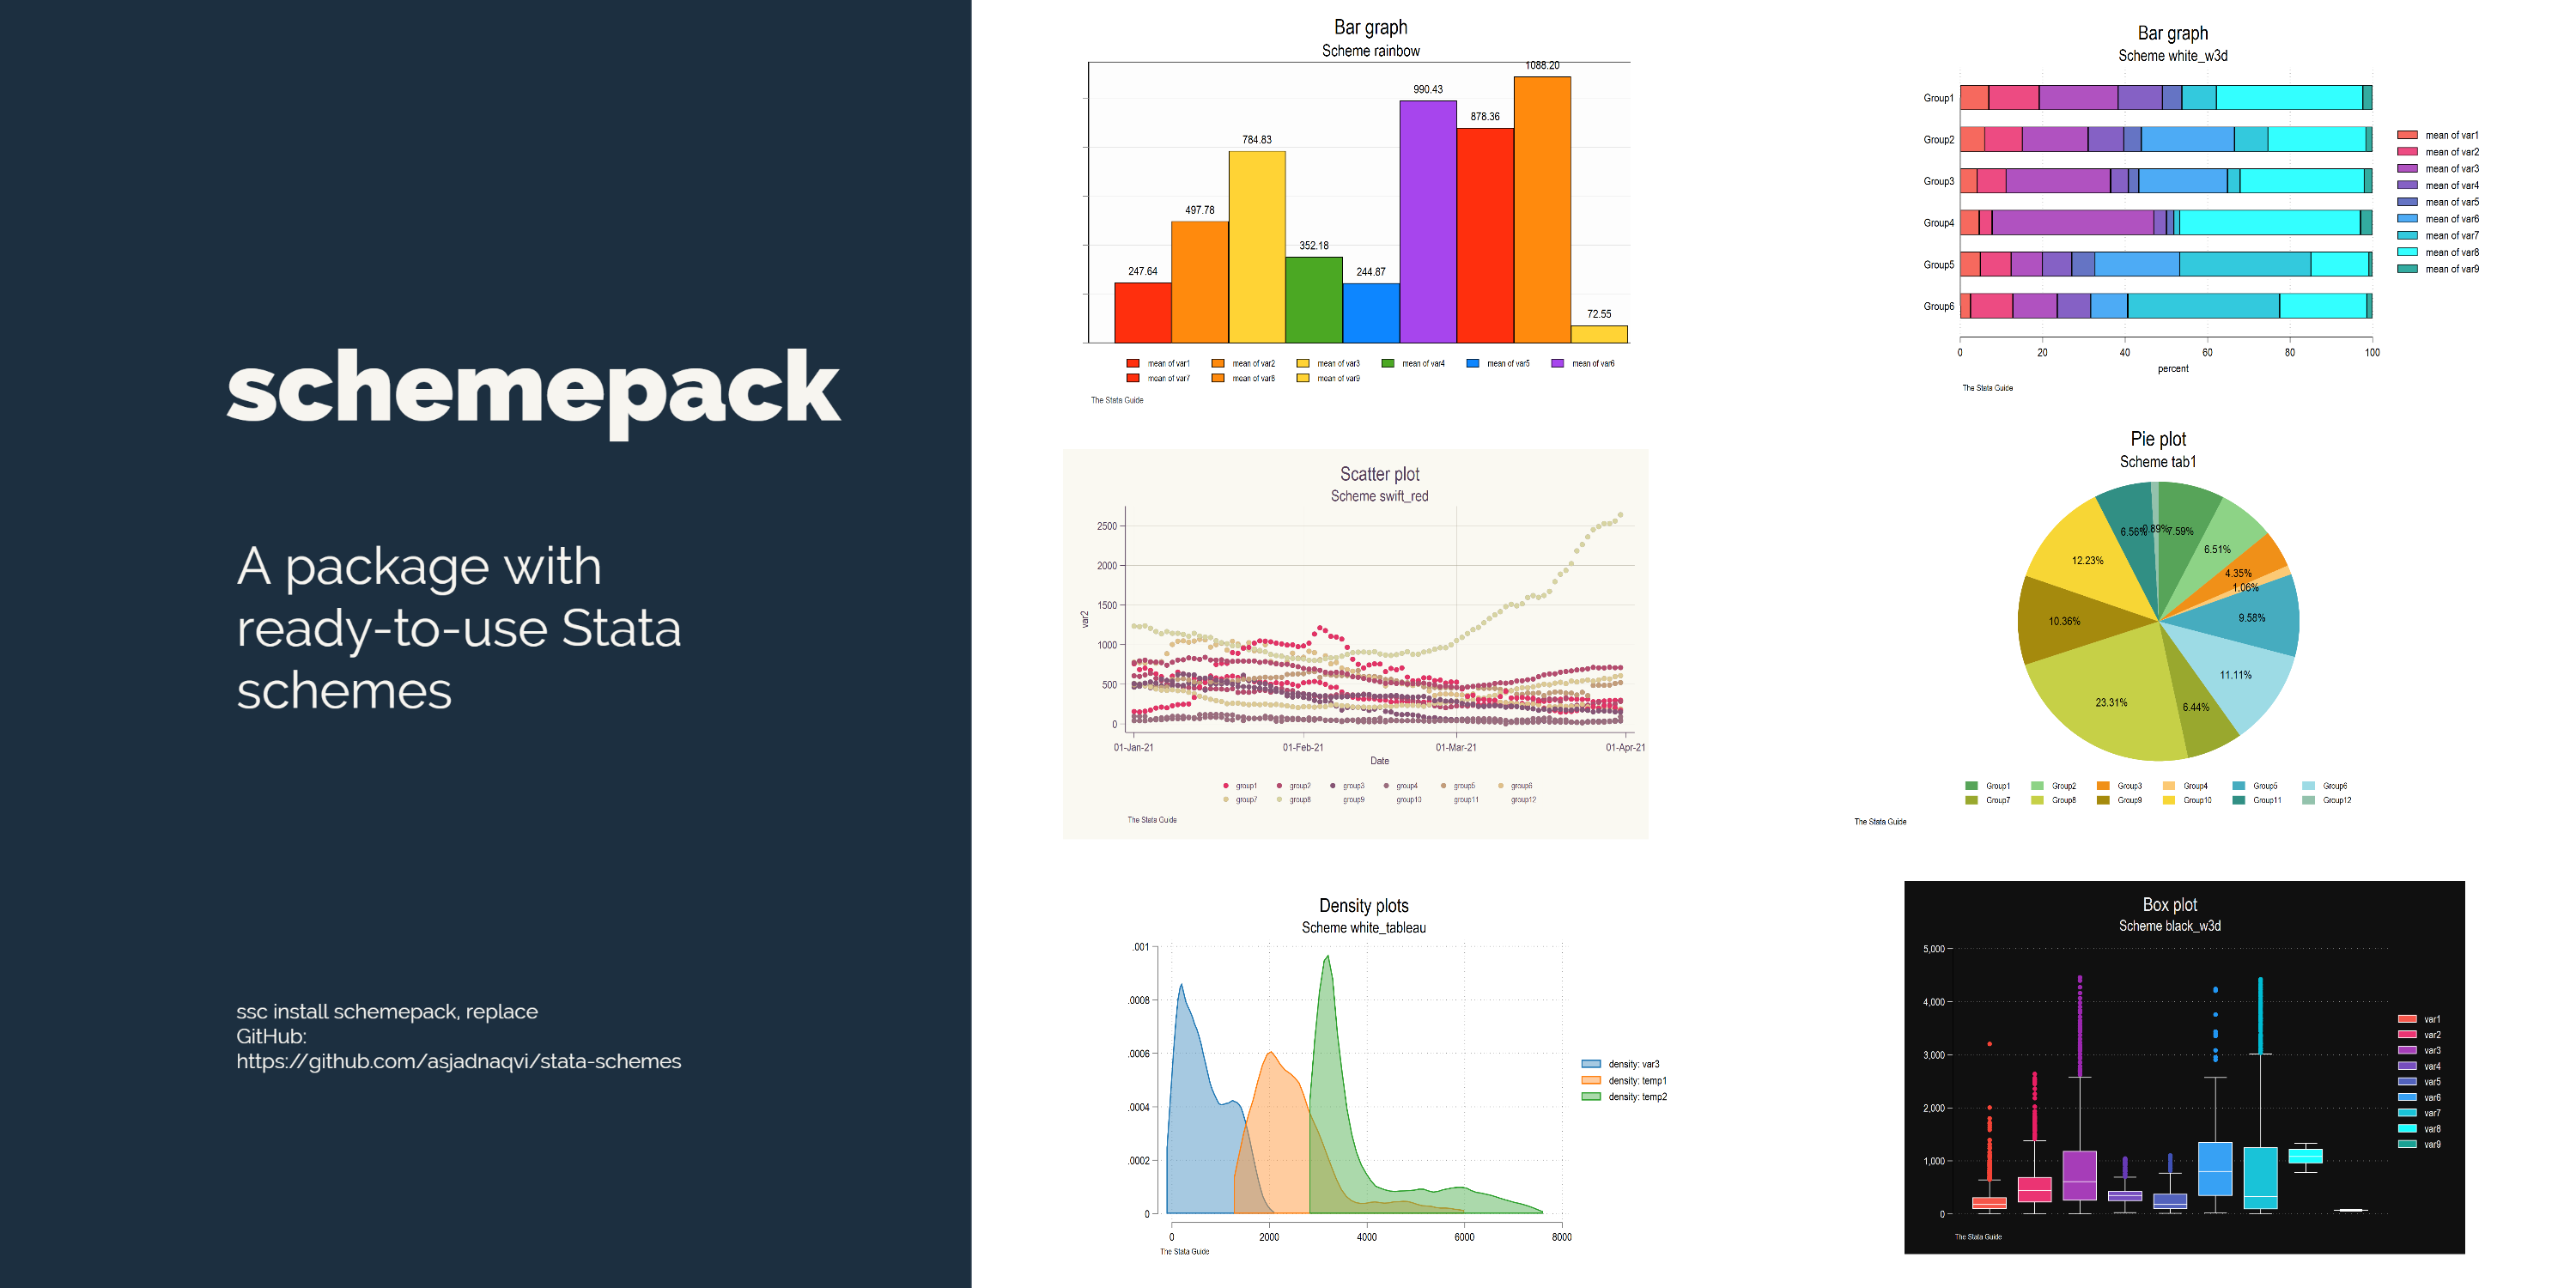
The Stata packages that are currently available online are listed below: