stata
I have been using Stata since 2004. But it was not until the 2020 COVID-19 lockdowns in Vienna that I started thinking more seriously about doing different types of visualizations to track the spread of the virus. In August 2020 I launched the Stata Guide on Medium to document the scripts for generating different types of visualizations. The aim of these guides was to consolidate the ever increasing code snippets and document the processes involved in creating the visualizations. The aim was to not only help myself but also allow the community to replicate them.
The popularity of these guides exploded on social media. But a recurring feedback was that setting up hundreds of lines of code for one visualization was not practical for everyone. Users wanted pre-canned on-line commands with some customization options. This also made sense from an average Stata user perspective, who is more focused on data analysis rather than spend time on custom visualizations.
In early 2021, I started converting the guides into Stata packages. As of updating this page, I have published over 20 programs. The figure below shows cumulative releases for each package by year:

Coding these was another intense learning process since I have never done this before. Even though programming took me away from writing the guides, the newly-gained Stata and Mata experience, and the engagements with various international organizations, researchers, policy people, and the broad community was (and is) highly rewarding.
Releasing packages in the public domain is like publishing a paper, with one key difference; a published paper usually stays as it online. In contrast, packages undergo continuous ex-post peer review, and are subjected to rigorous testing, as users (including myself) find bugs and/or request new features. Some features, such as support for weights and label wrapping, have also been added across the board. And with 20+ packages, this is a significant time sink if one also take into account updating help files, the GitHub pages, writing release notes, checking and adding sample figures, and so on. Currently, the most-used packages are in a very solid place. The most popular ones are also fairly robust, offering a wide range of features that cater to a diverse set of user requirements. Some visualizations from these packages have also started appearing in articles and blogs (although packages citations are still missing. Hint hint!).
I do plan to eventually return to blogging with the aim of writing more about the knowledge accumulated in the last years. Even in its current dormant state, the Stata Guide on Medium has over 60 articles where most of them are still useful for learning about coding visualizations. Some of the fundamental guides are also no longer paywalled. I have also set up the Stata Gallery on Medium where the community continues to contribute their own amazing guides. So please also check it out and submit your own articles if you have something in mind.
Workshops and presentations
I regularly present my work in various conferences. For example, my Advanced Visualizations with Stata series has introduced tons of new material and visualization types. I also regularly conduct workshops and seminars. Some of these are also open to public such as the Masterclass in Stata Maps course that I conduct annually in collaboration with Stata UK. I have also conducted workshops directly for various institutions and universities on topics such as workflow management, Stata frames, advanced visualizations and maps. If you would also like to organize one then please reach out!
")
")
Client engagement
I also contract directly with clients such as multilateral organizations, ministries, and universities to support them with data workflows, creating piplines for complex data analysis, customizing visualization packages, and even directly creating visualizations for various reports etc. Doing this type of work was not really planned but some of these projects were too exciting to pass. Even though I cannot say much about these projects till they are officially launched, it is usually around them that the packages get a burst of upgrades followed by social media activity. If you also want support with large projects then please reach out!
Portfolio and packages
You can view my StataViz Portfolio or follow my social media accounts for updates.
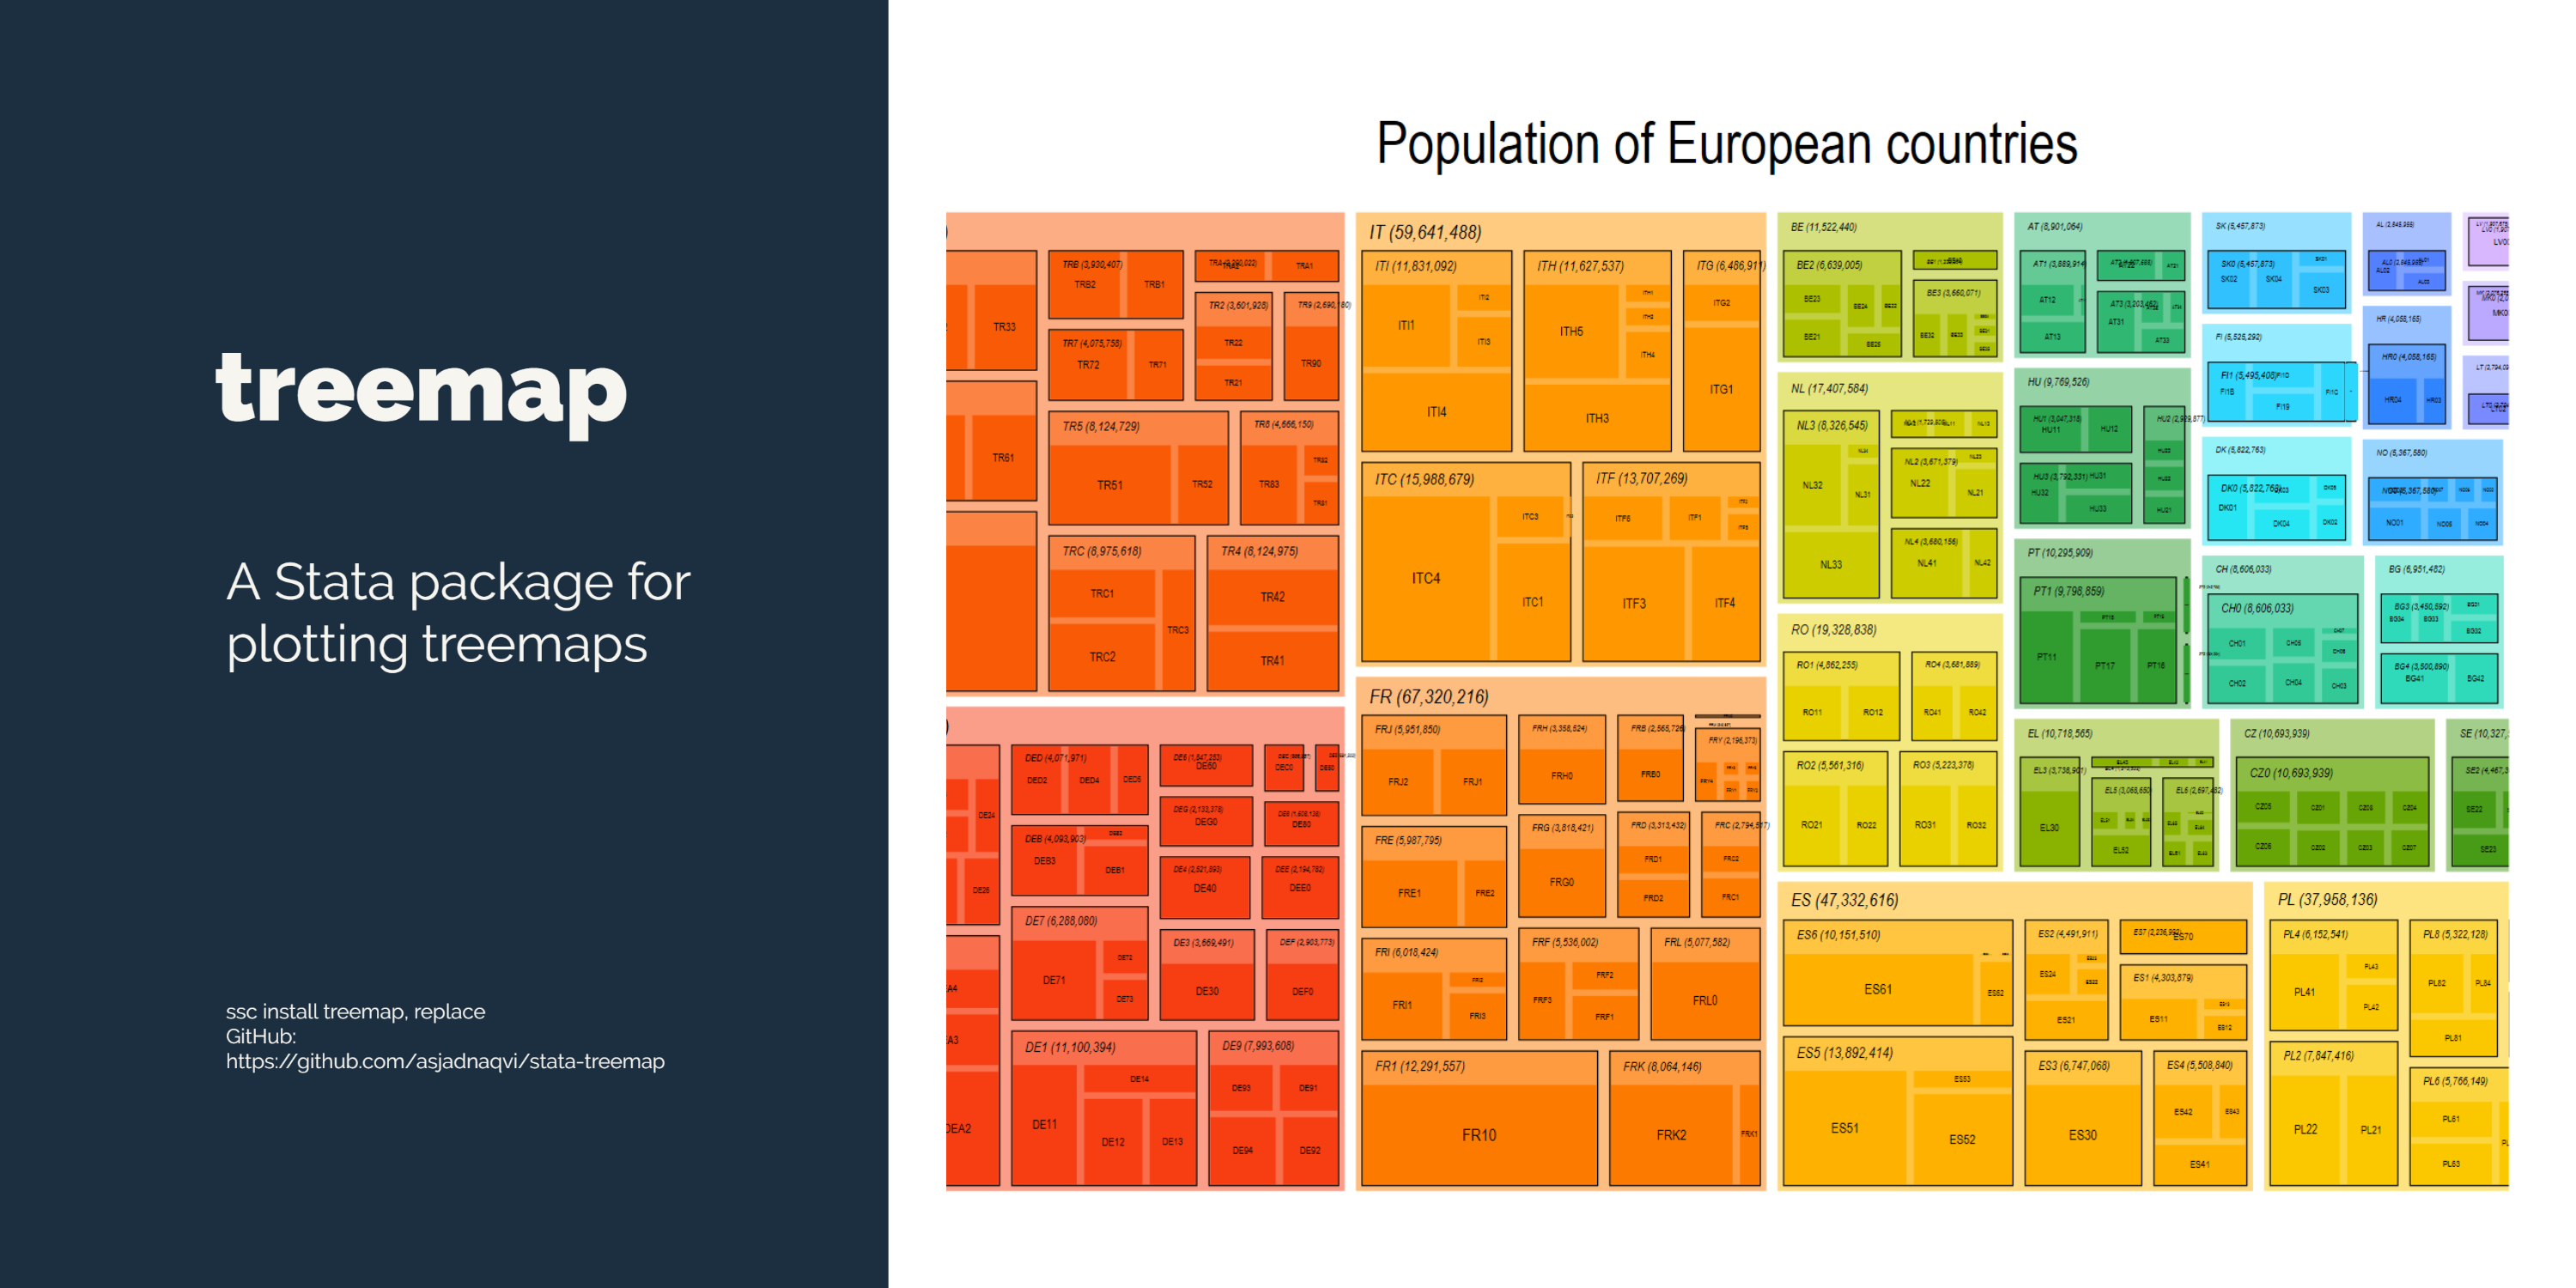
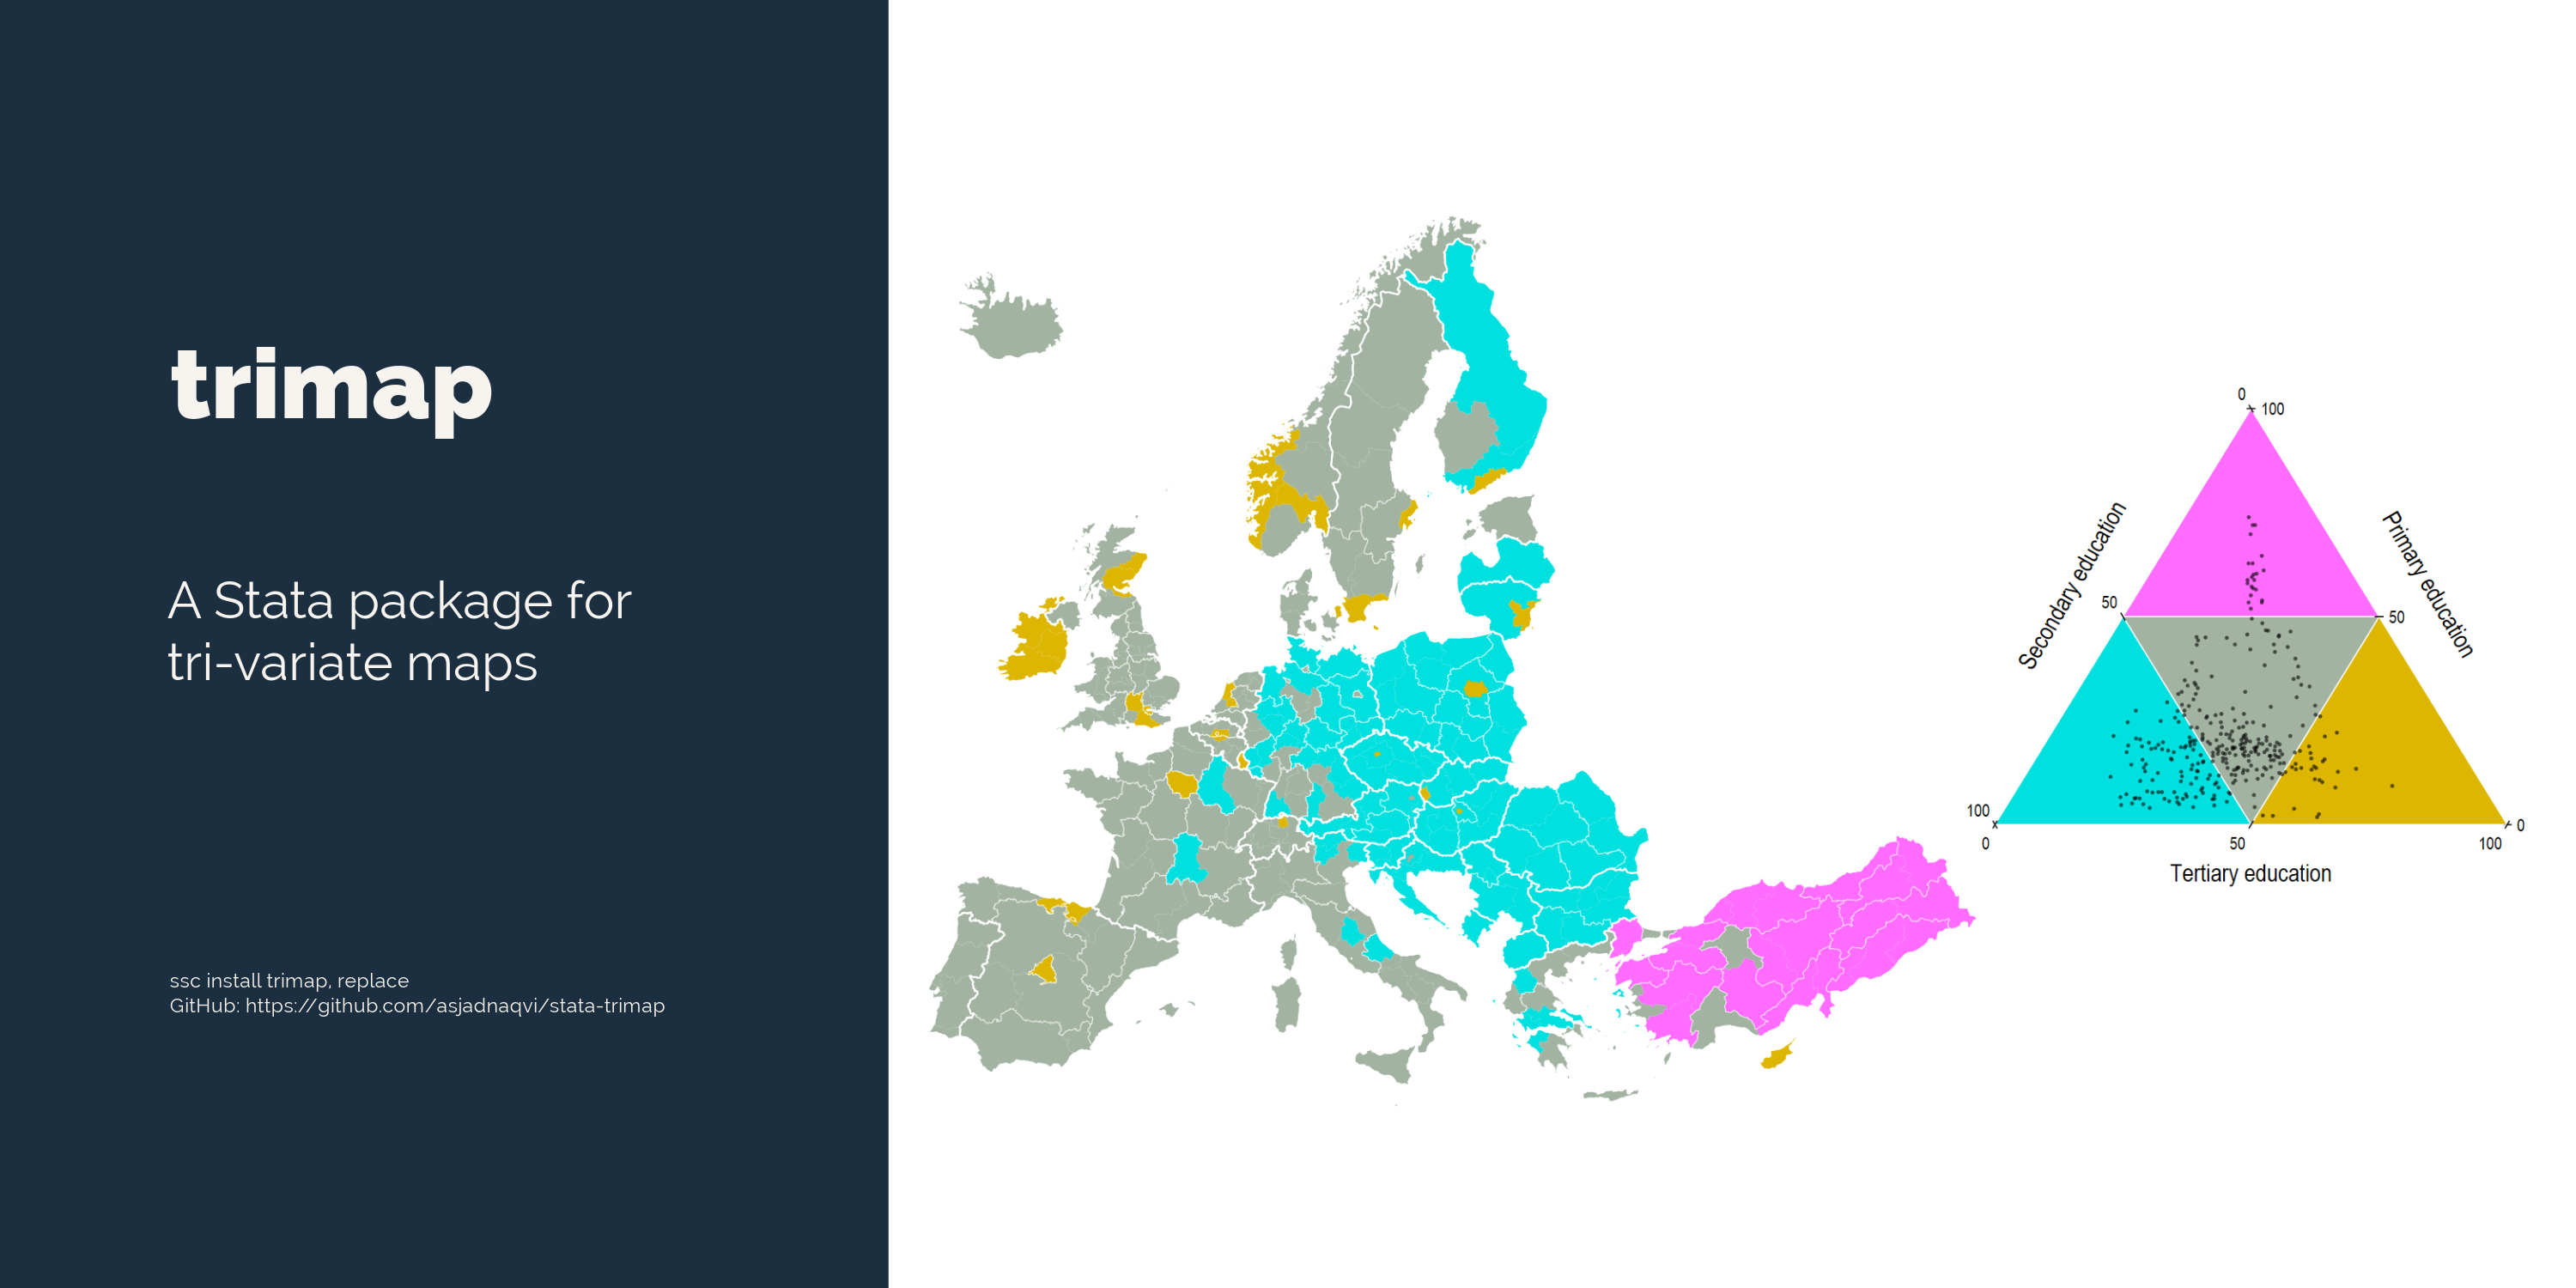
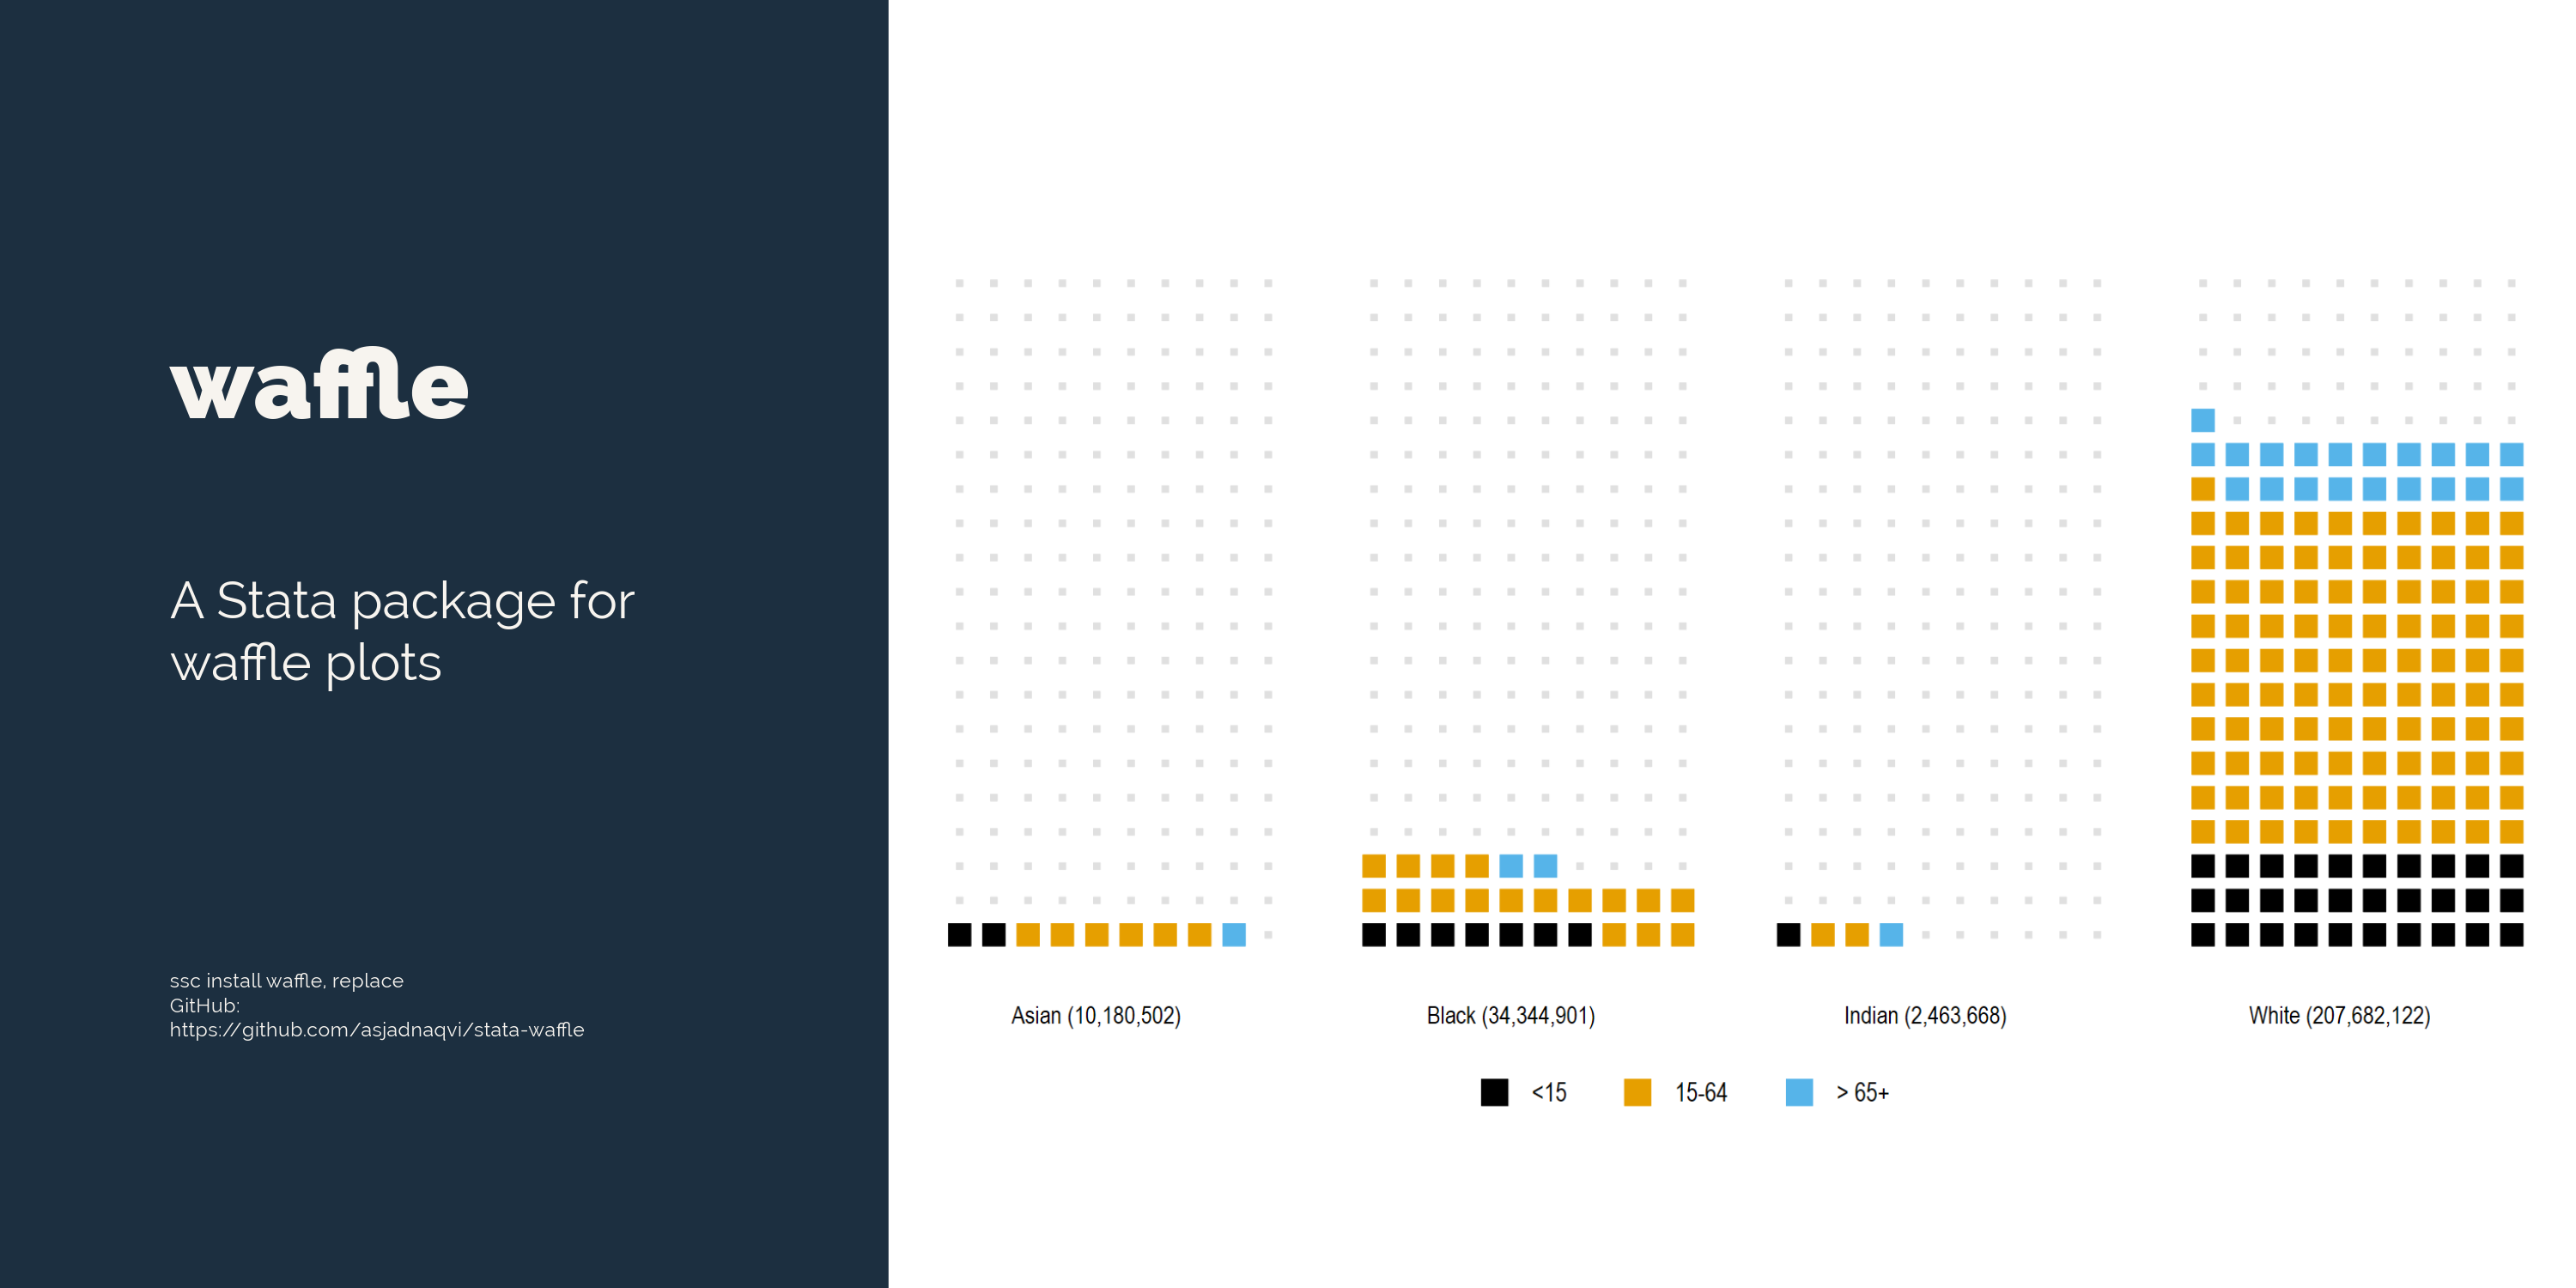
The list of Stata packages that are currently online are listed below: